
In this post we developed a method for identifying products that visually look similar. The task at hand consisted on implementing an algorithm that given an image of a product, selects three alternative images that look alike.
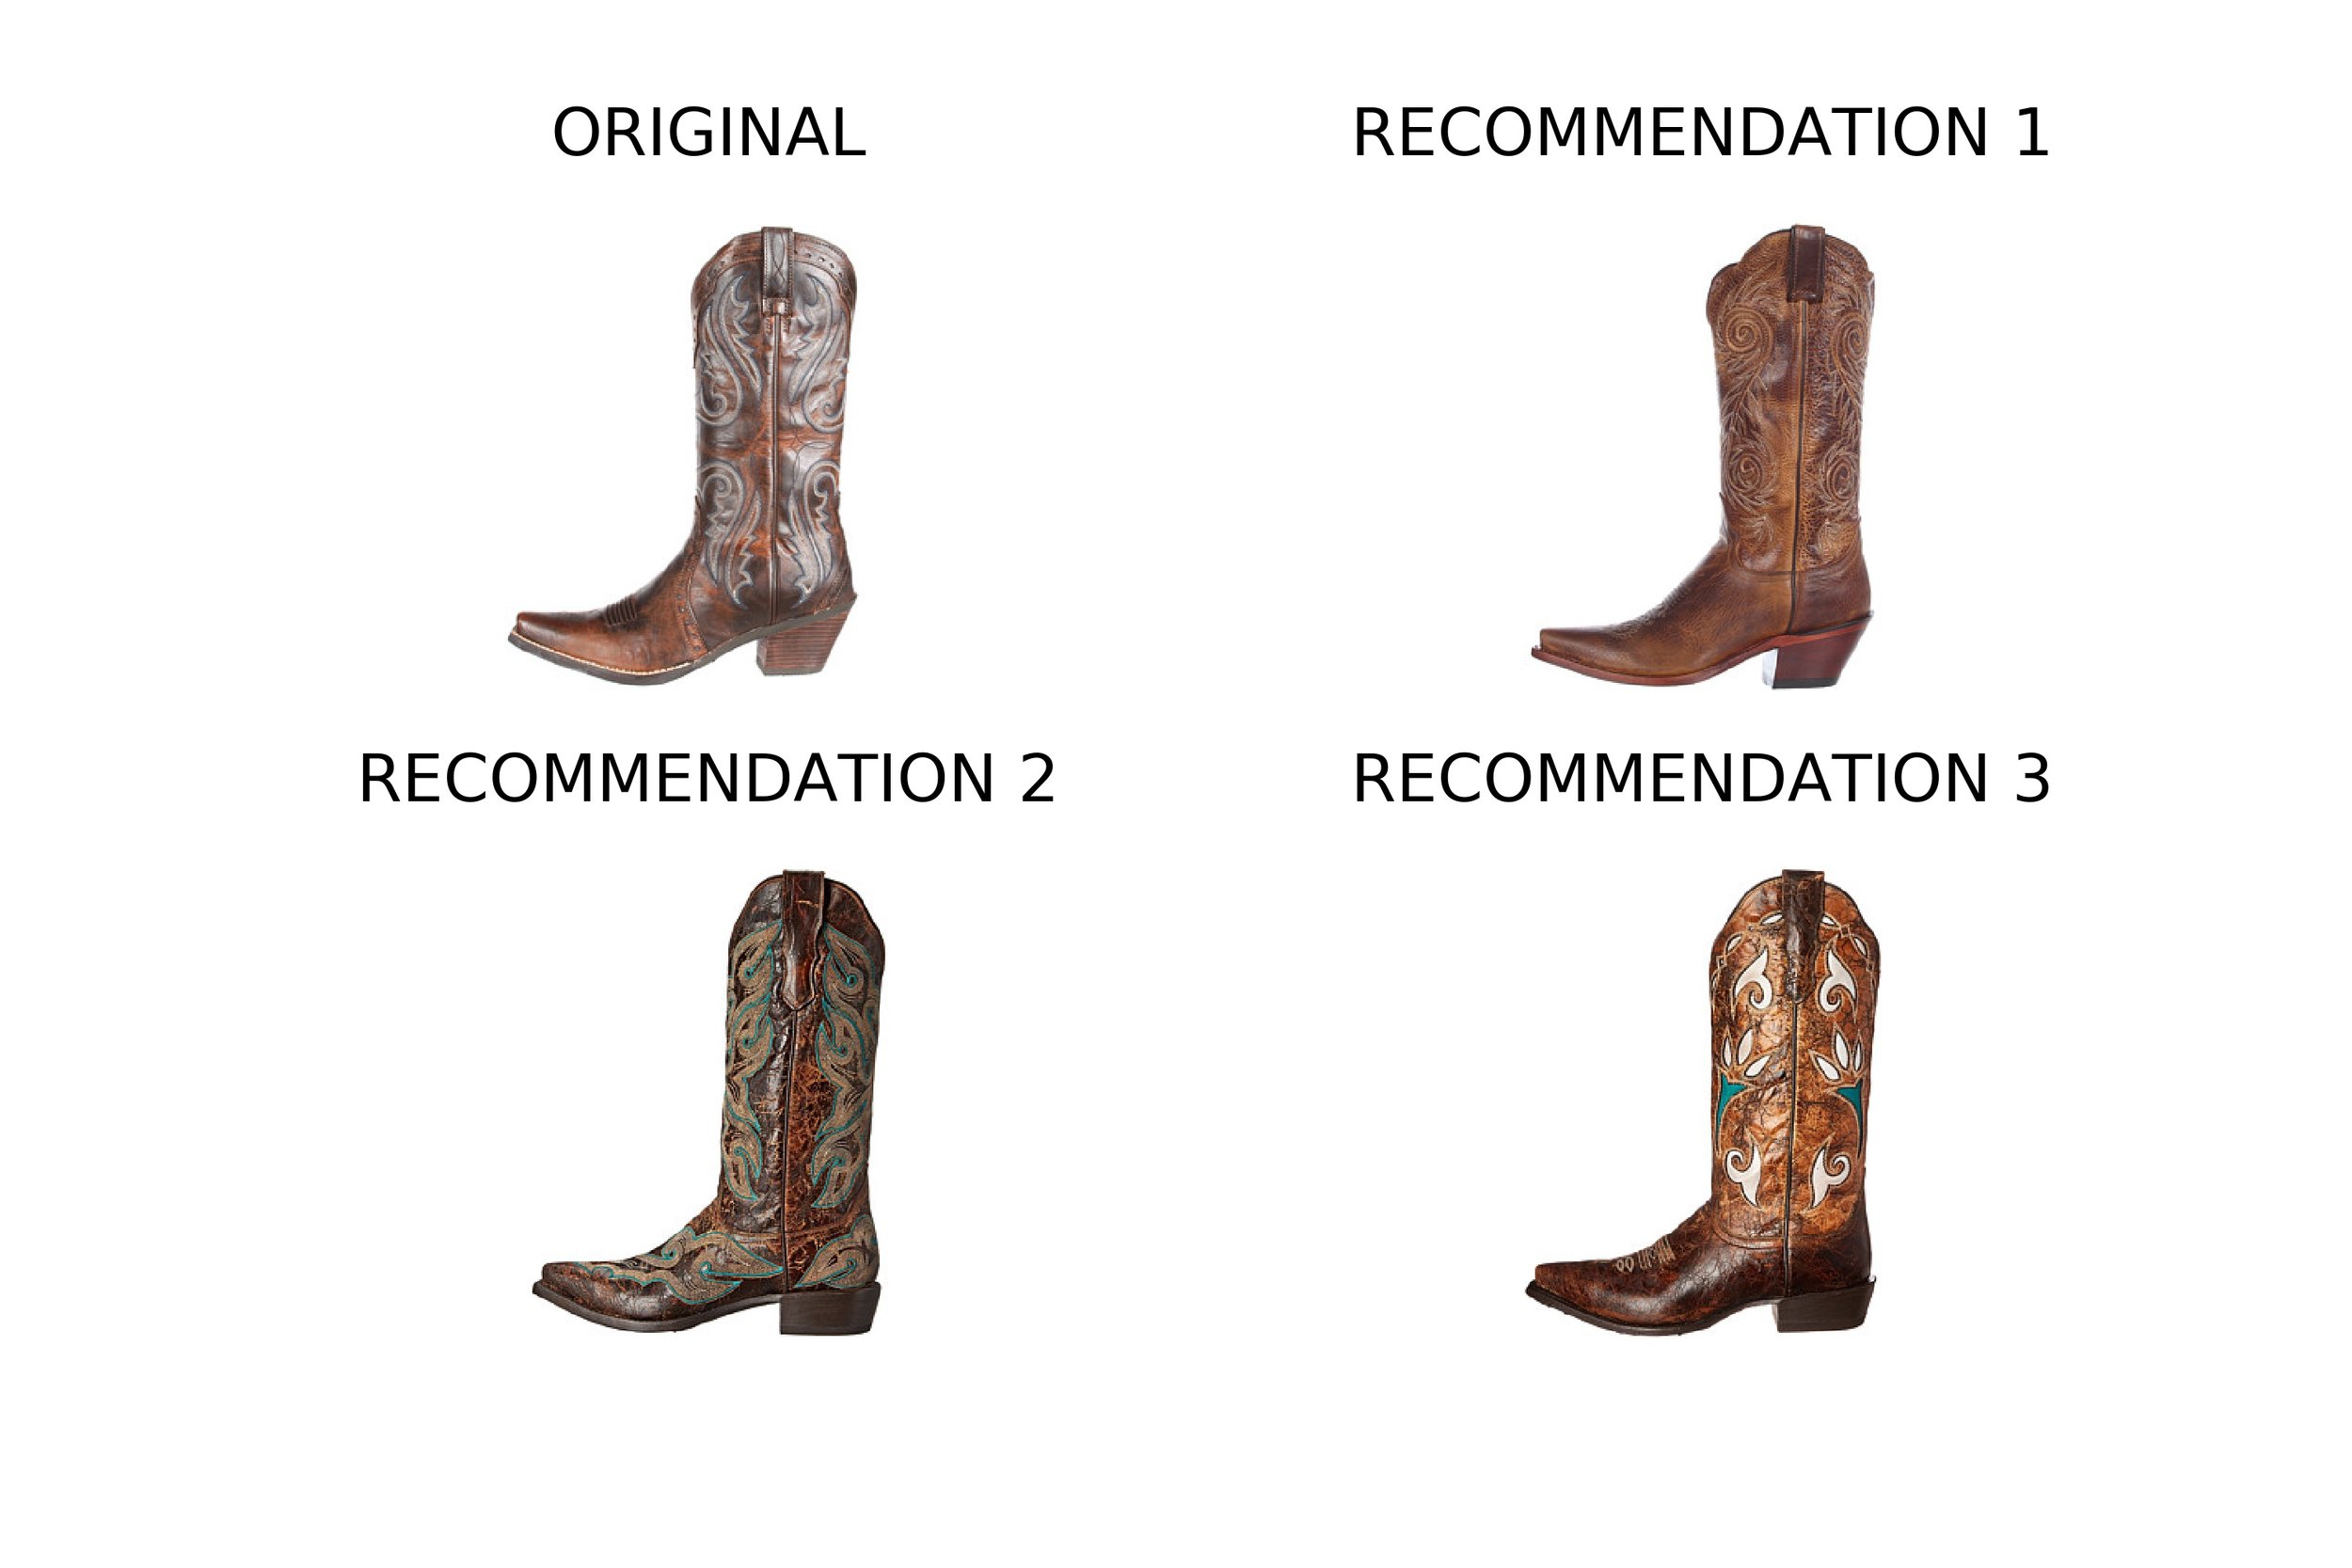
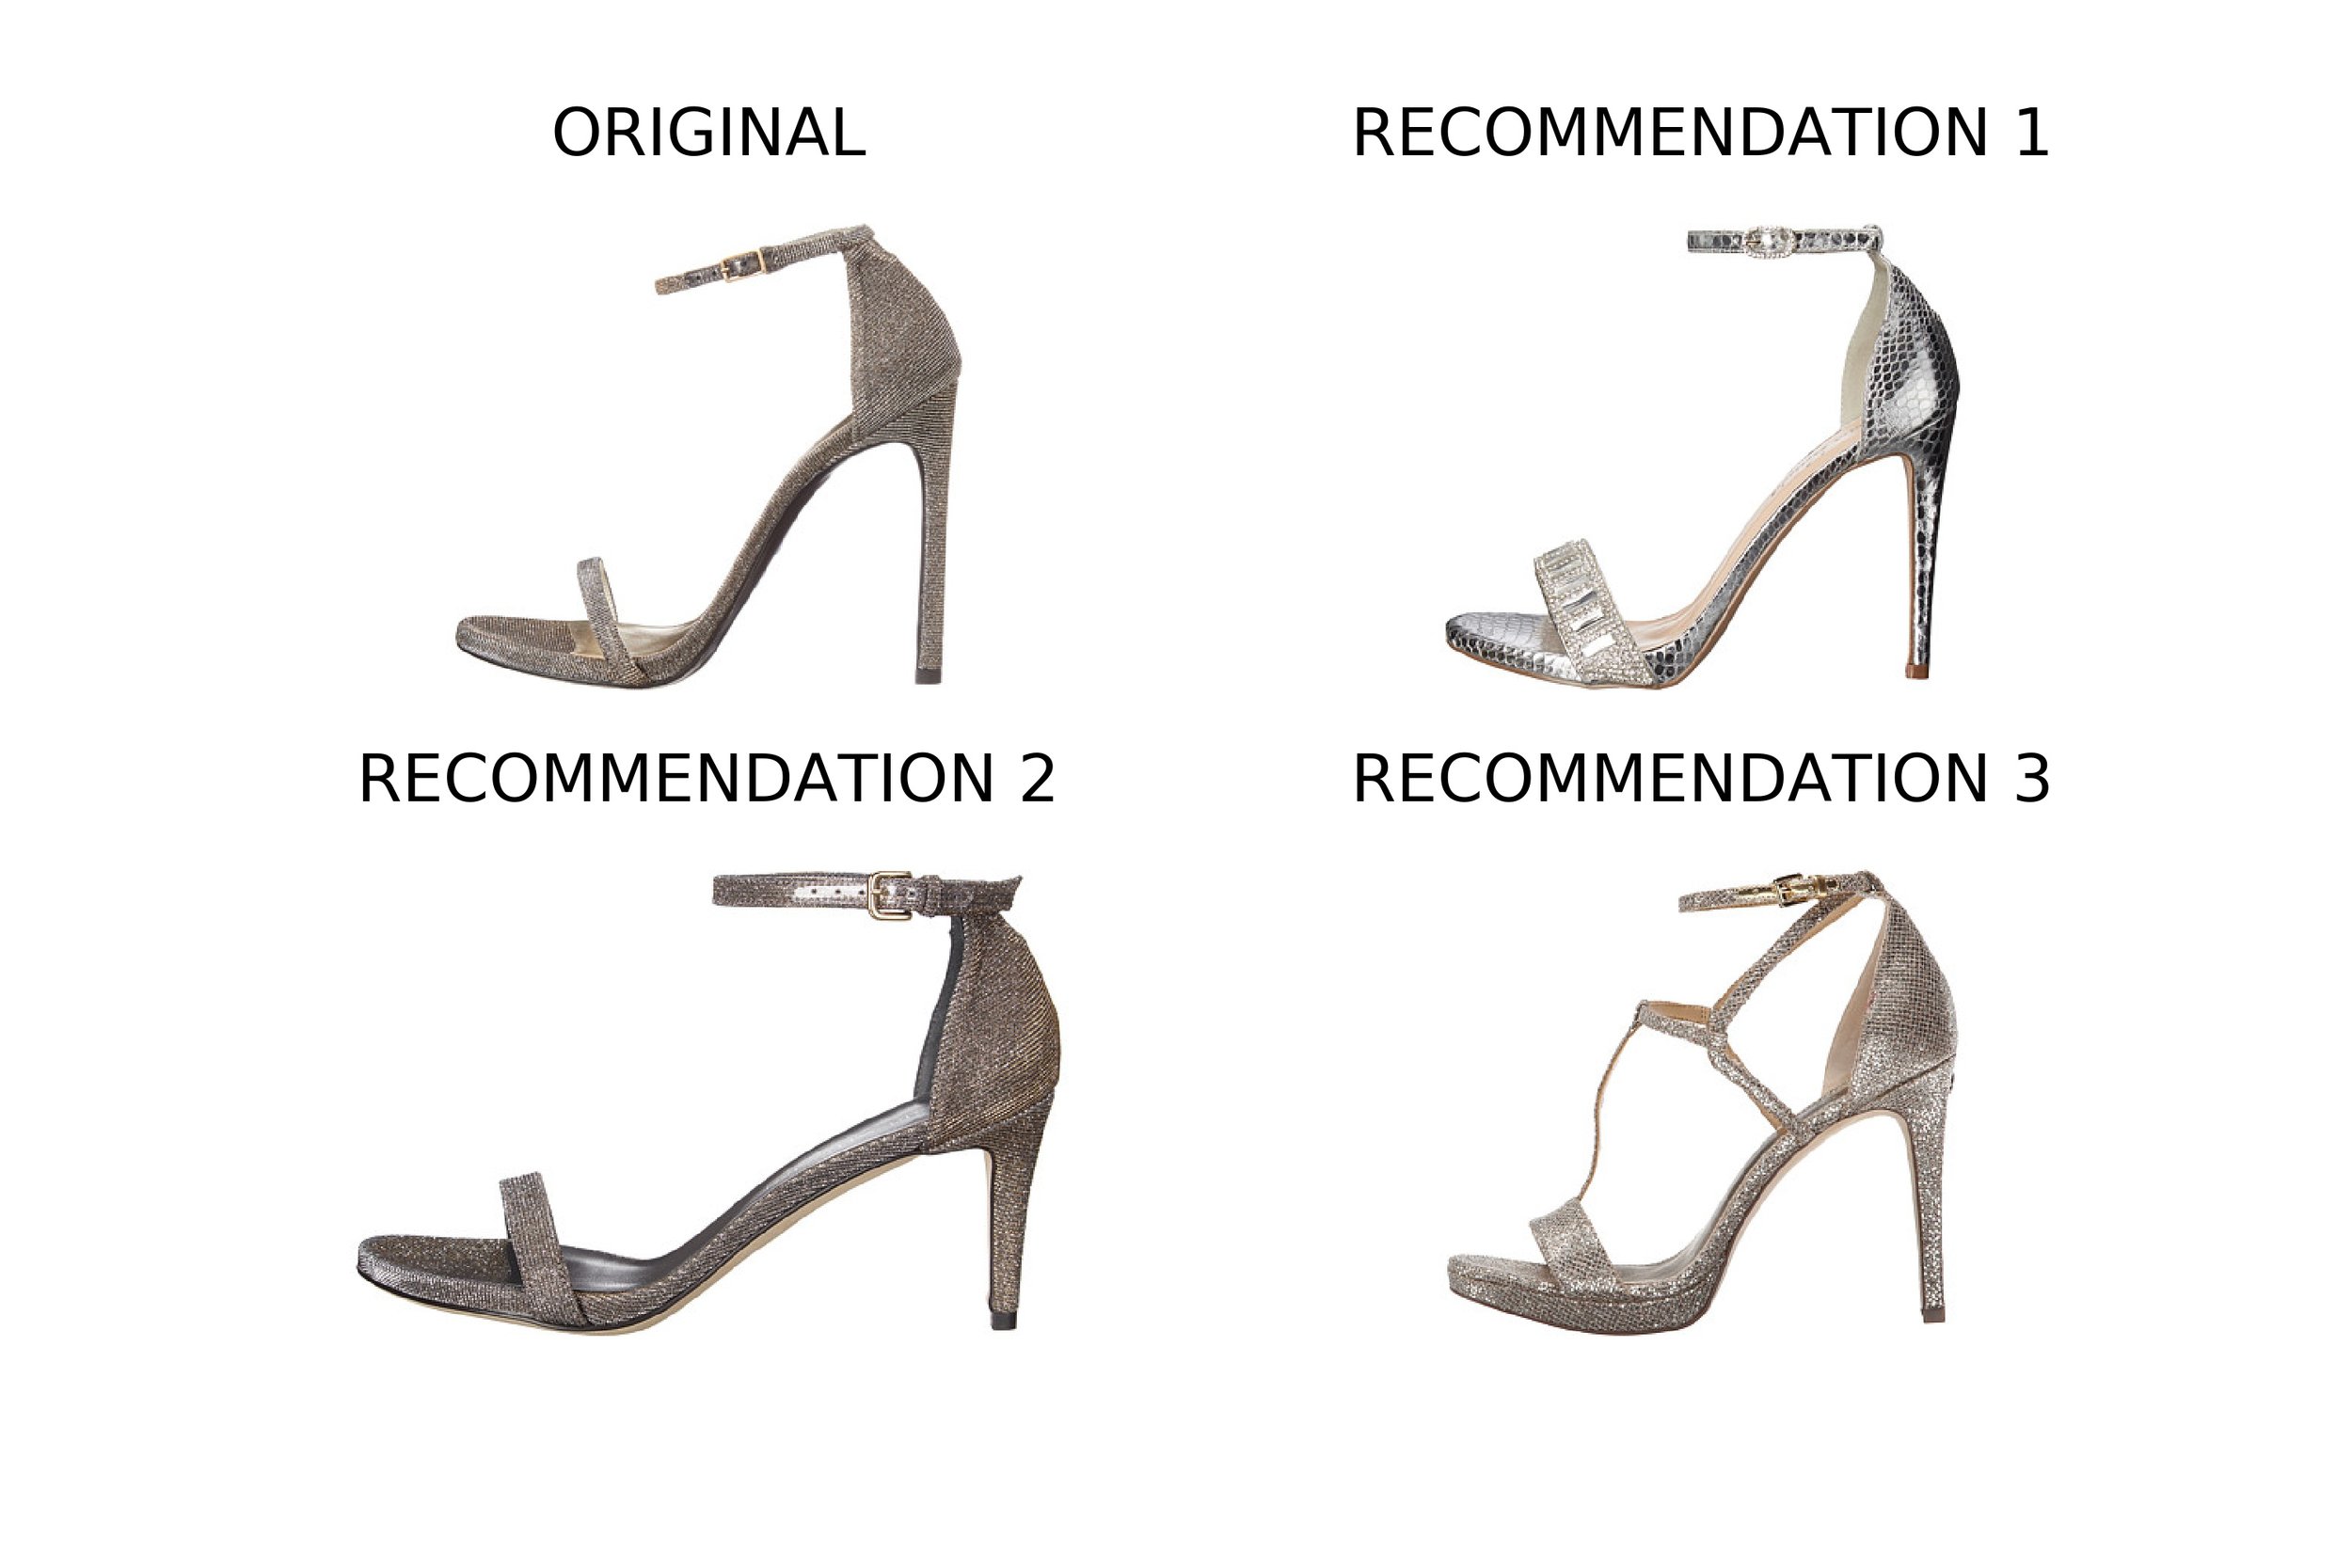
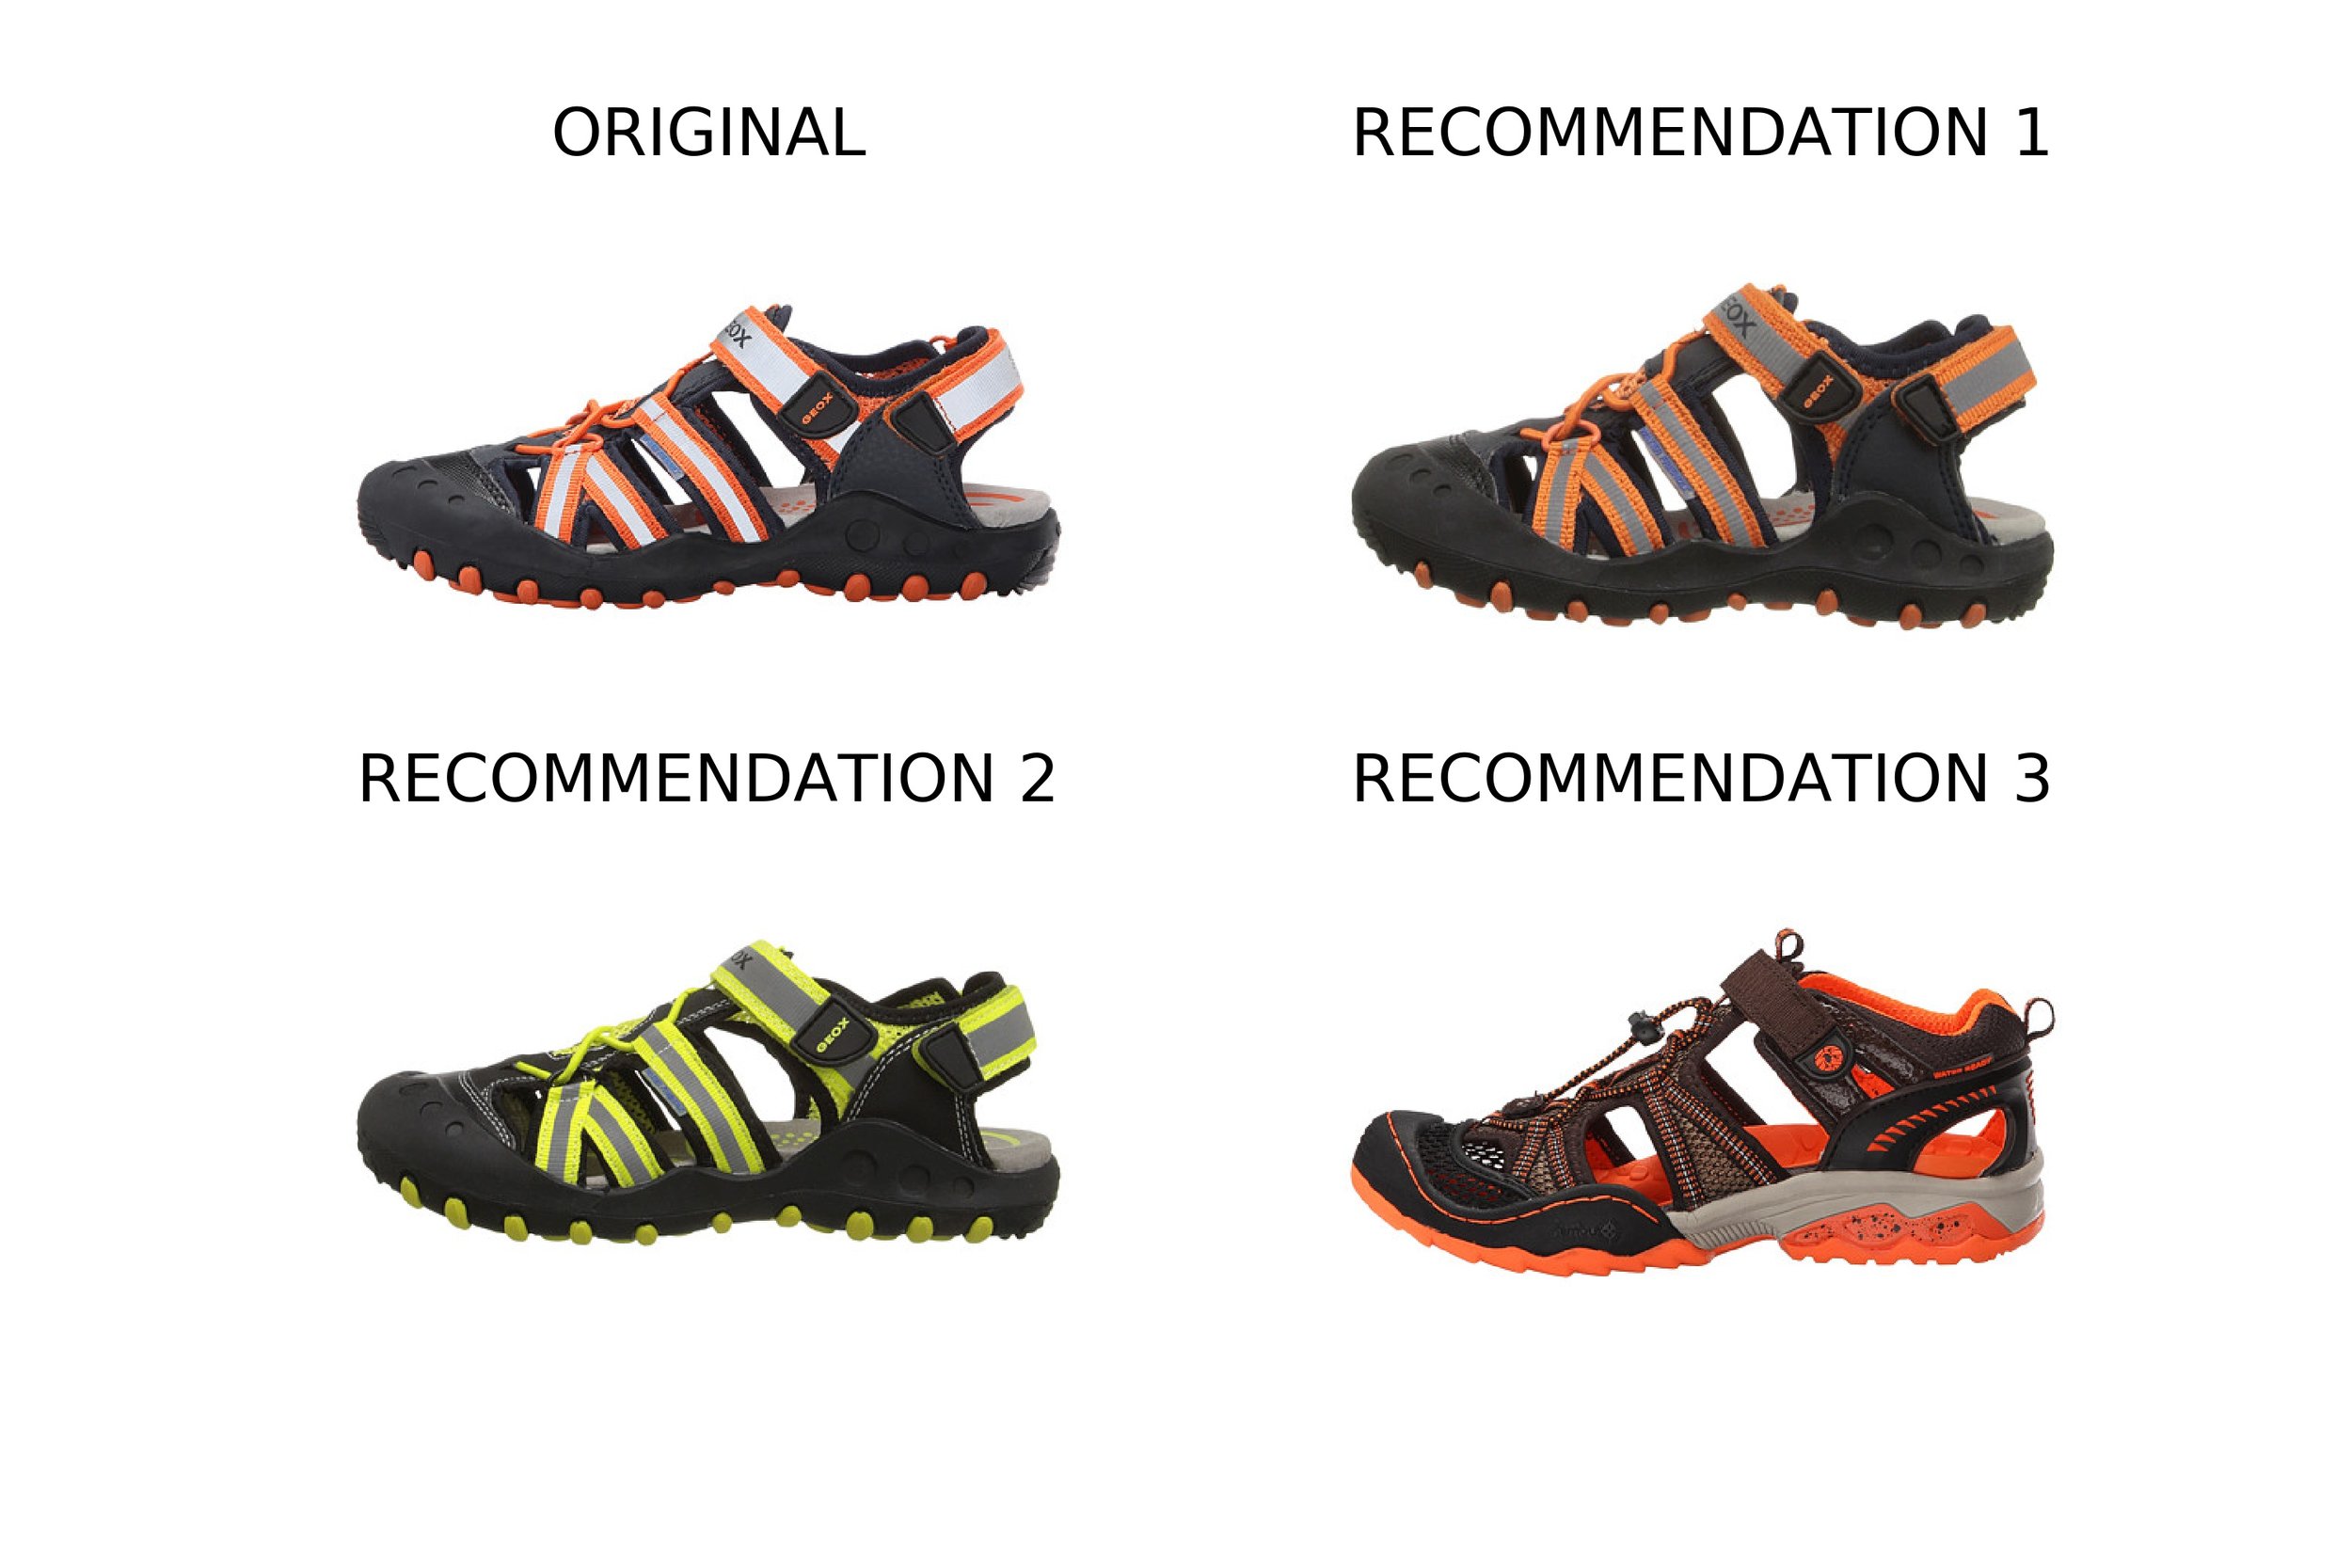
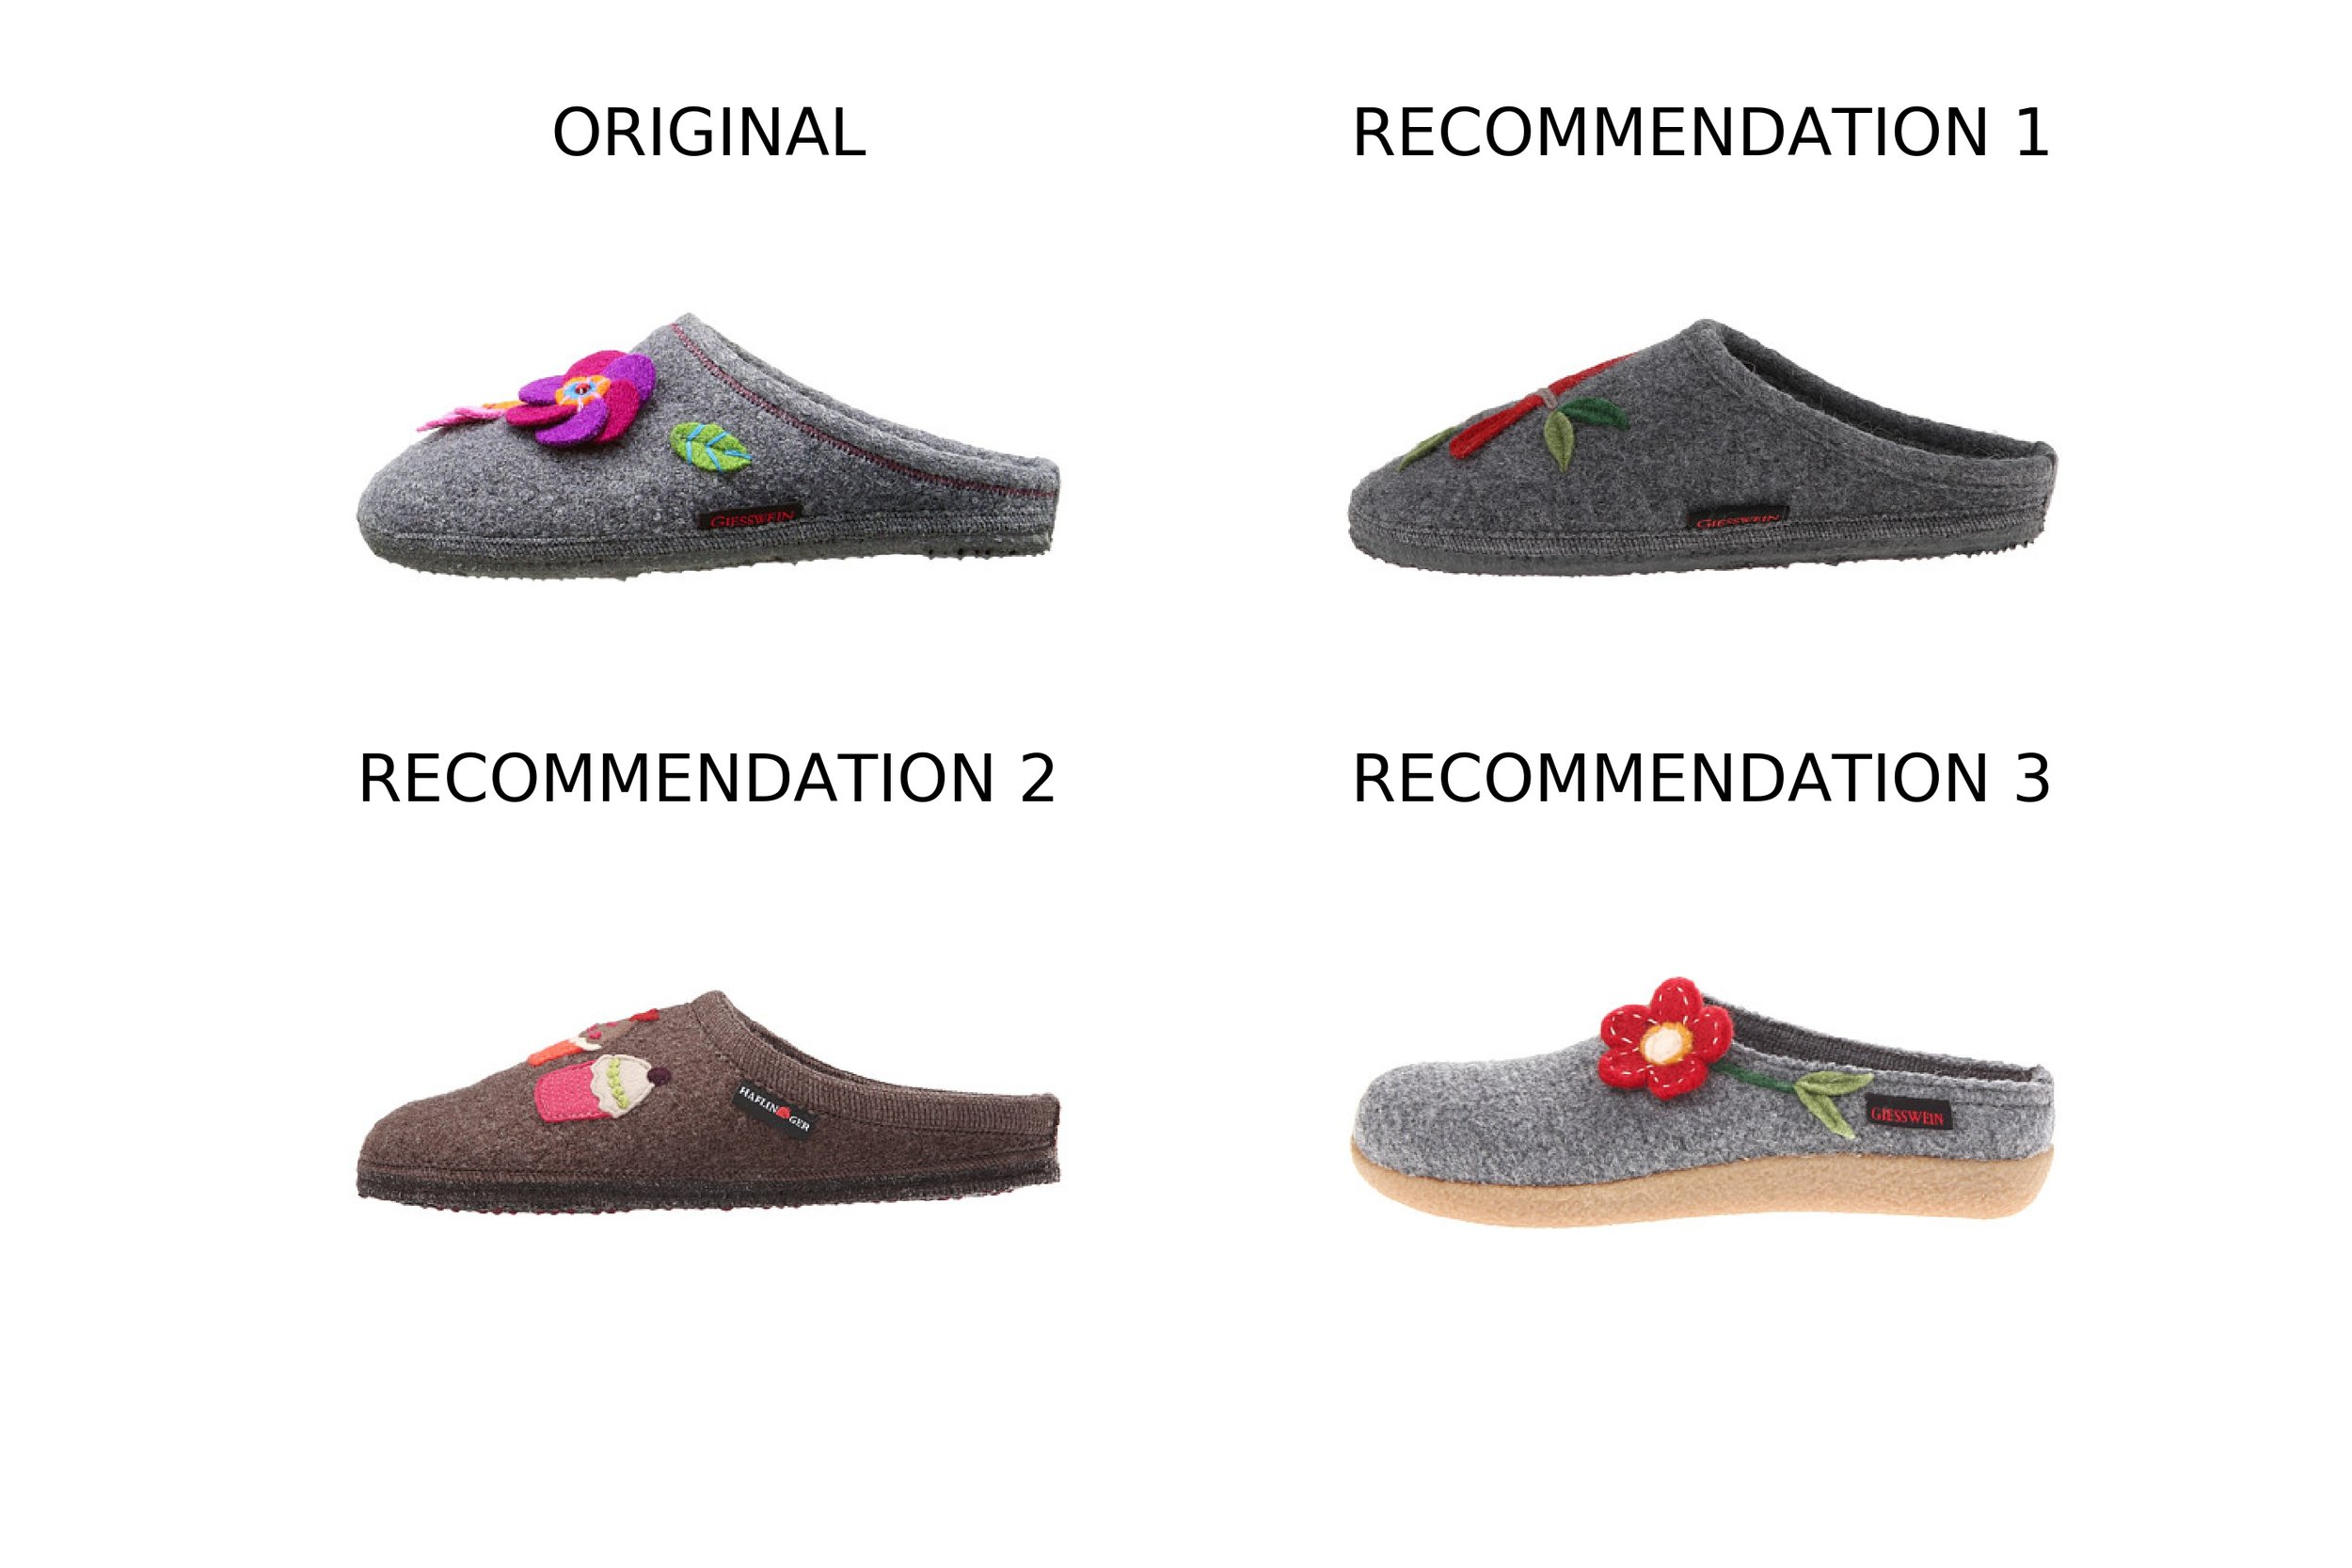
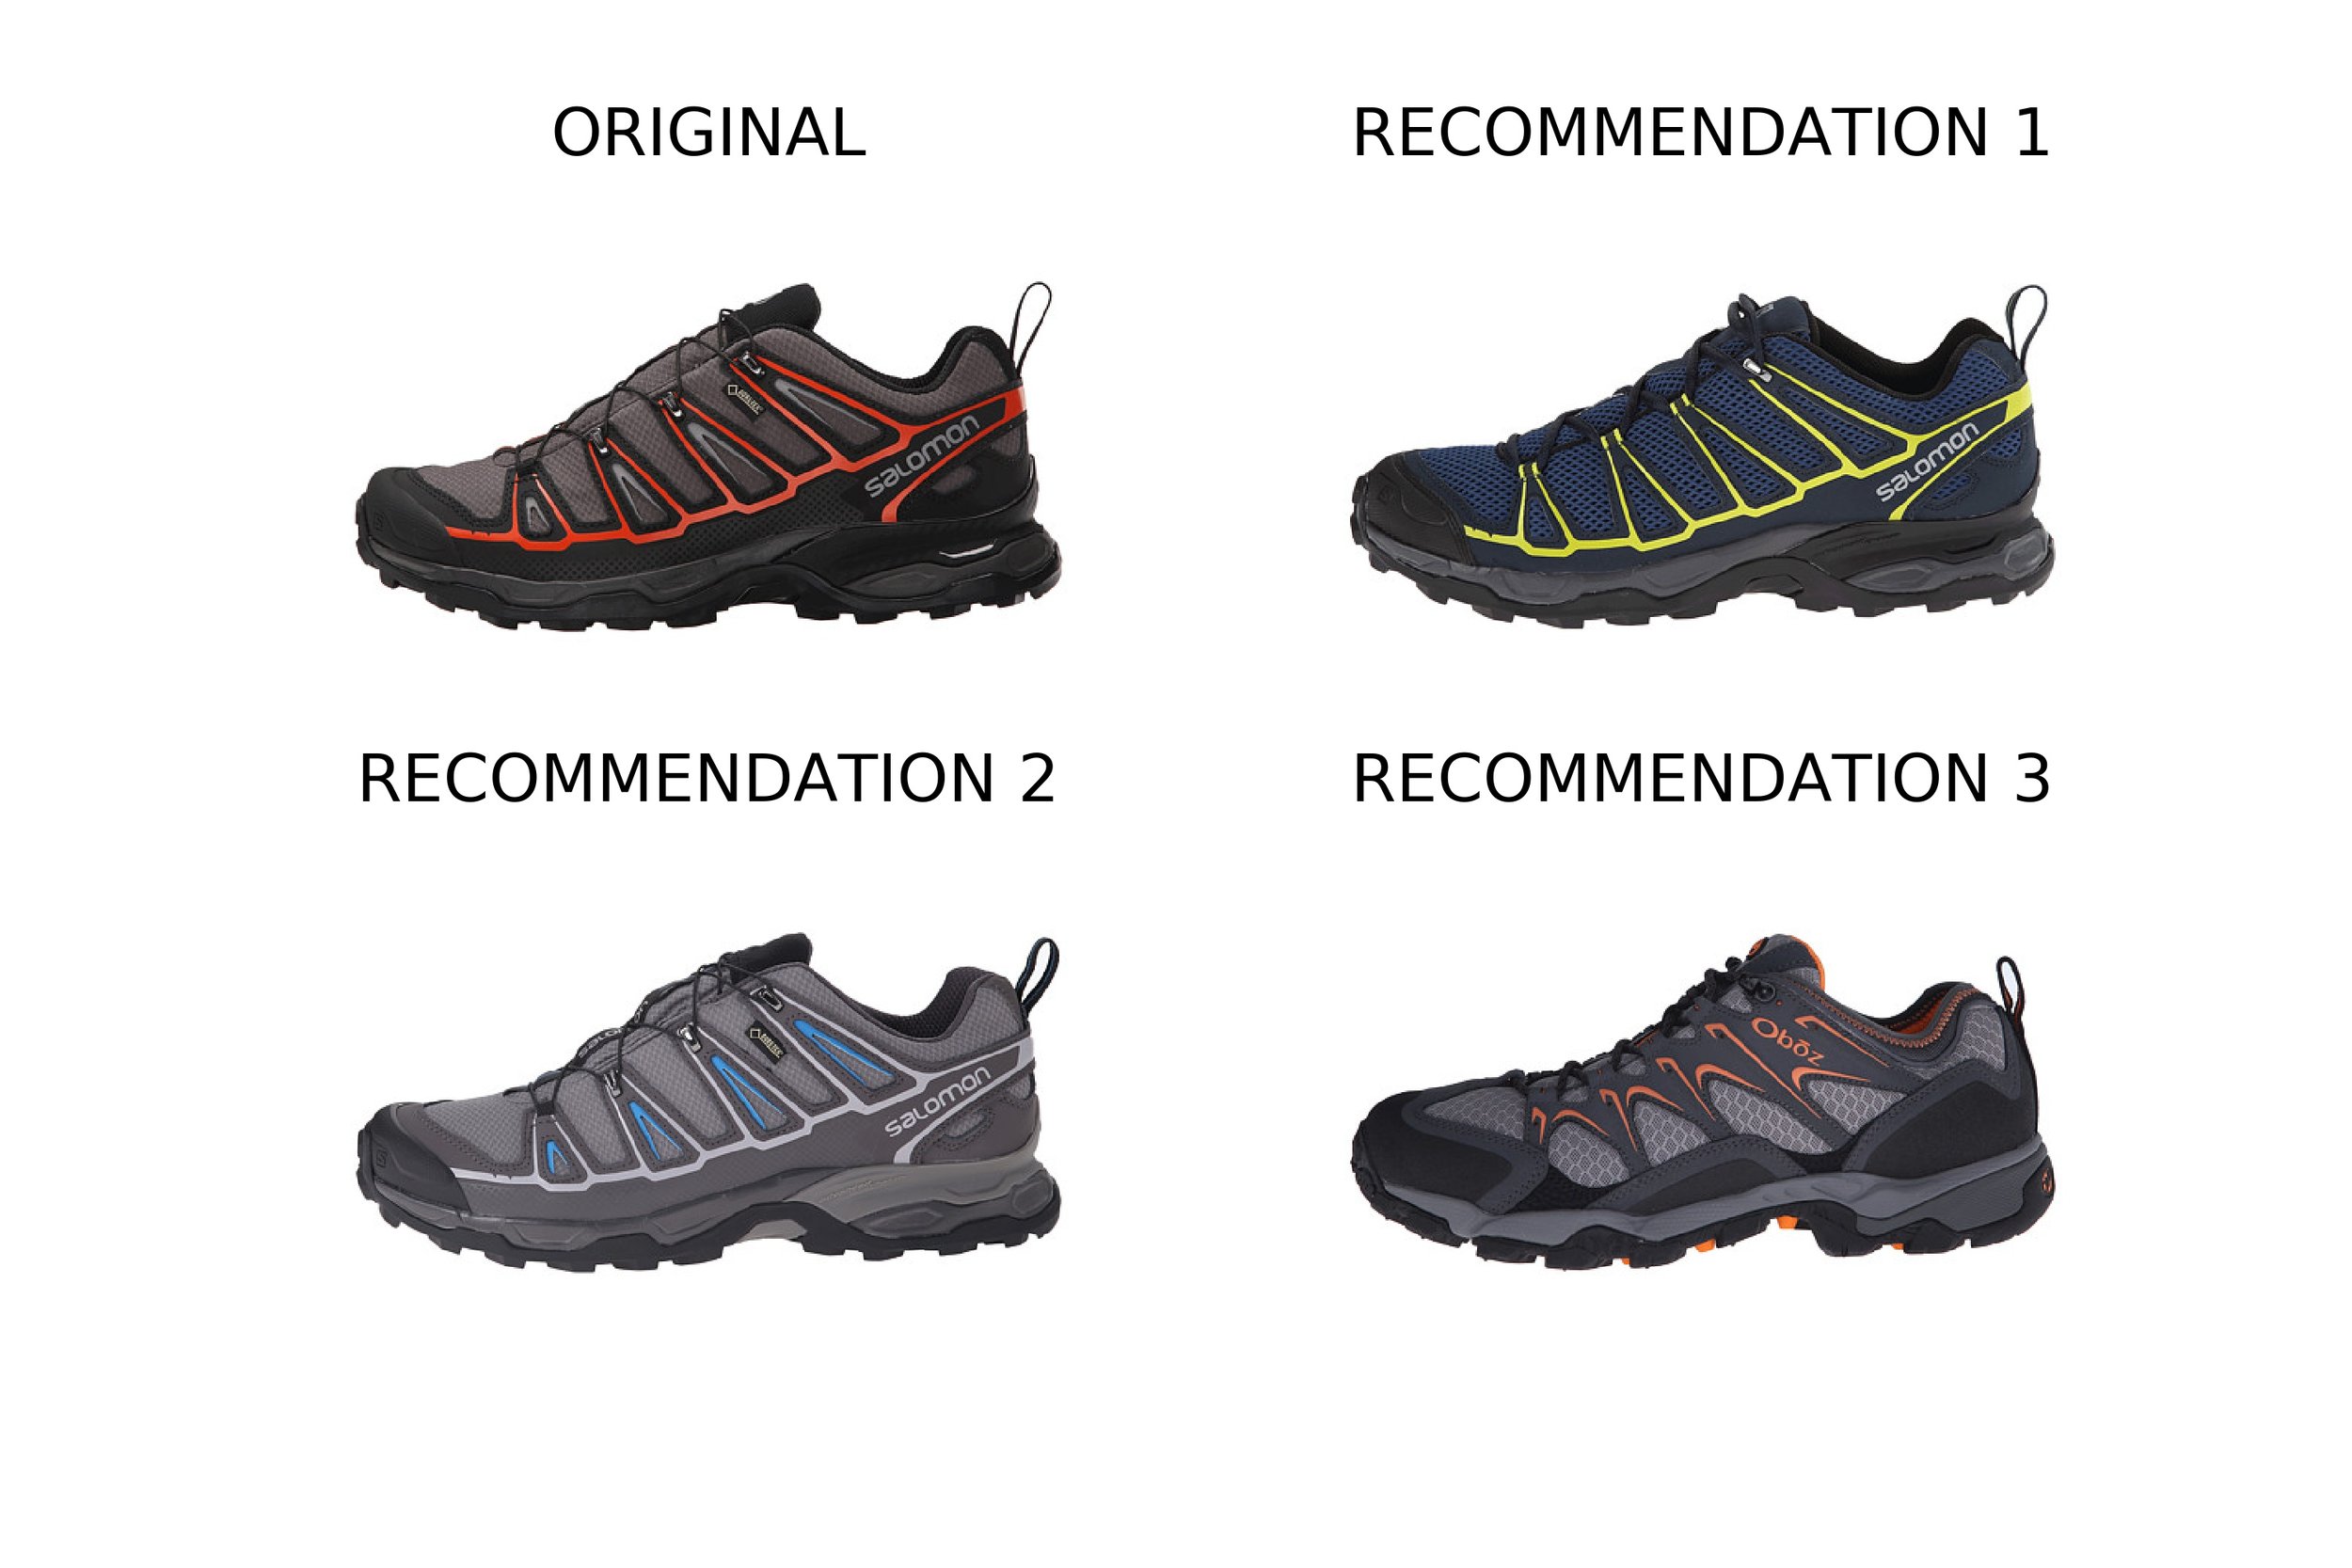
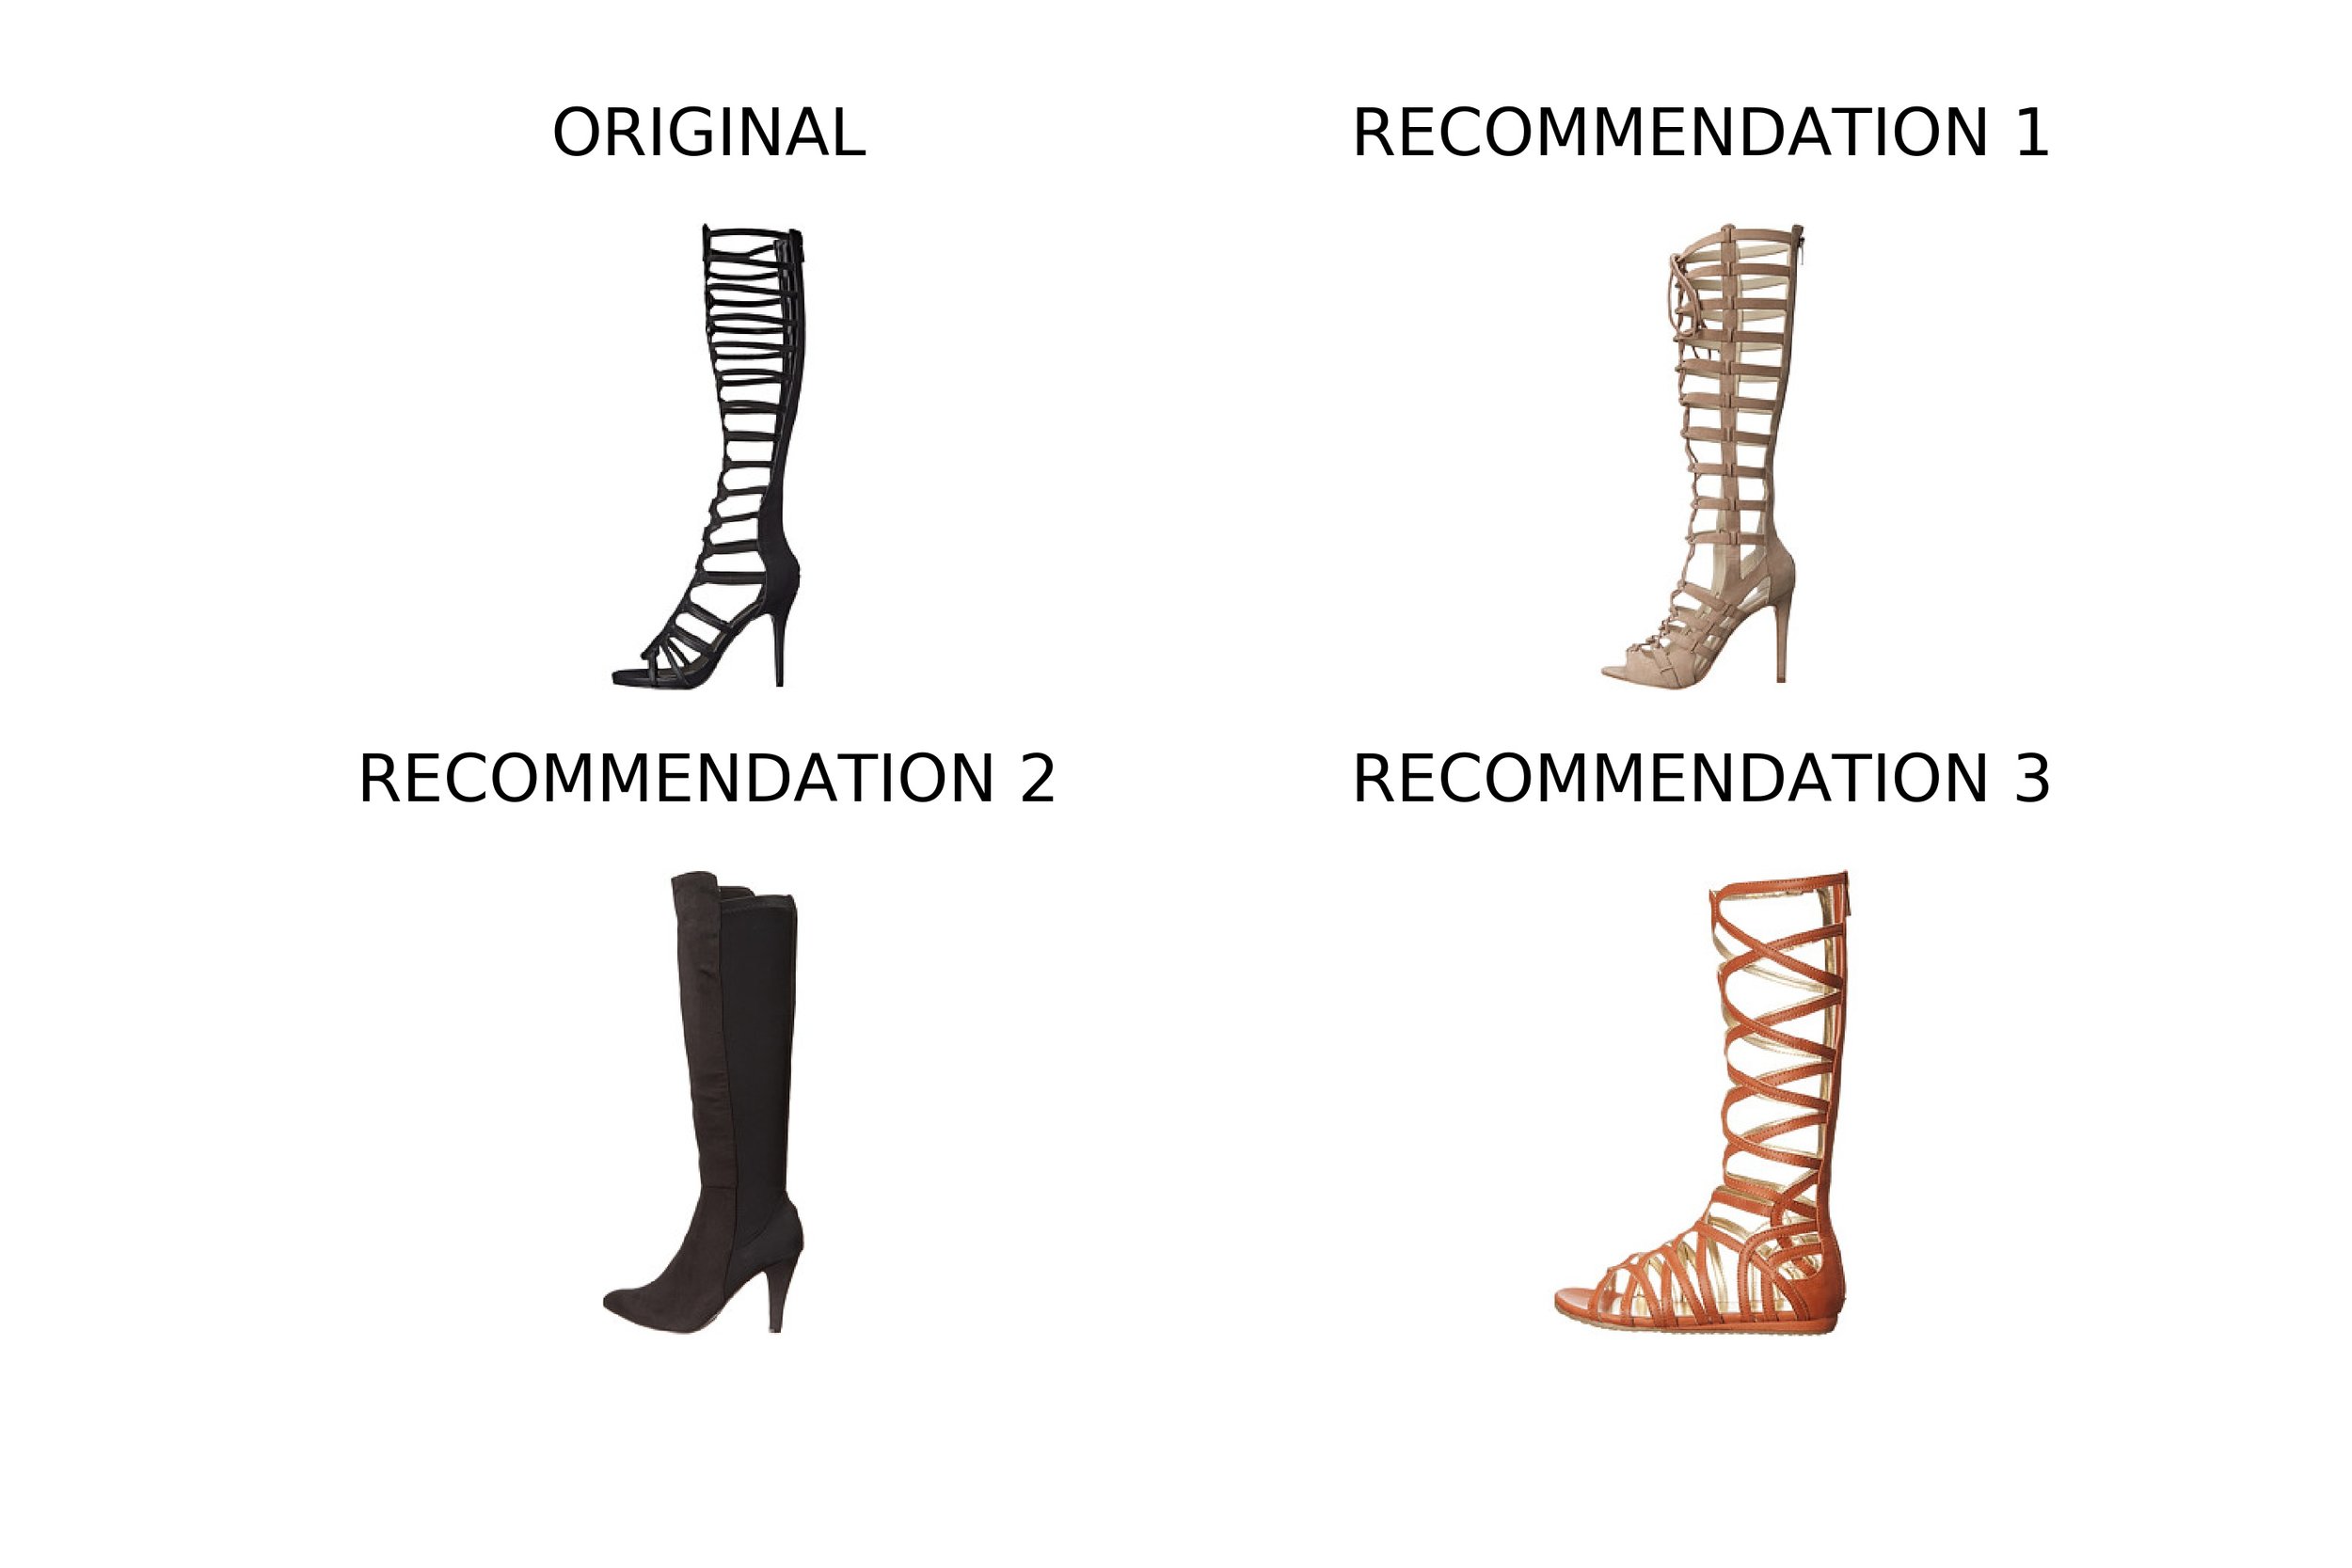
Specifically, I used images of shoes as the product. An example of the results can be observed in Figure 1, where the top left image is the original image of a shoe, and then we observe 3 recommendations of products that are comparable replacements.
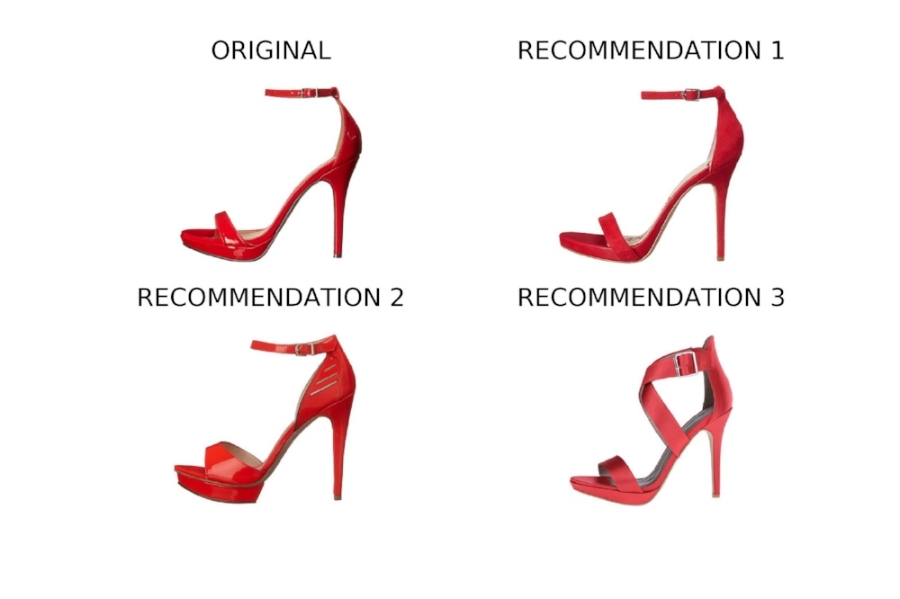
Figure 1: Top left, image of the original image selected. Top right, bottom left and bottom right are the top three recommendations.
DATA
We compiled over 25,000 color images of unique shoes. Each image has a size of 360 x 480 x 3 pixels (they are RGB). All the images had a white background, and the shoes were presented on a side view with the toe pointing towards the left side. A sample of the data set is presented in Figure 2.
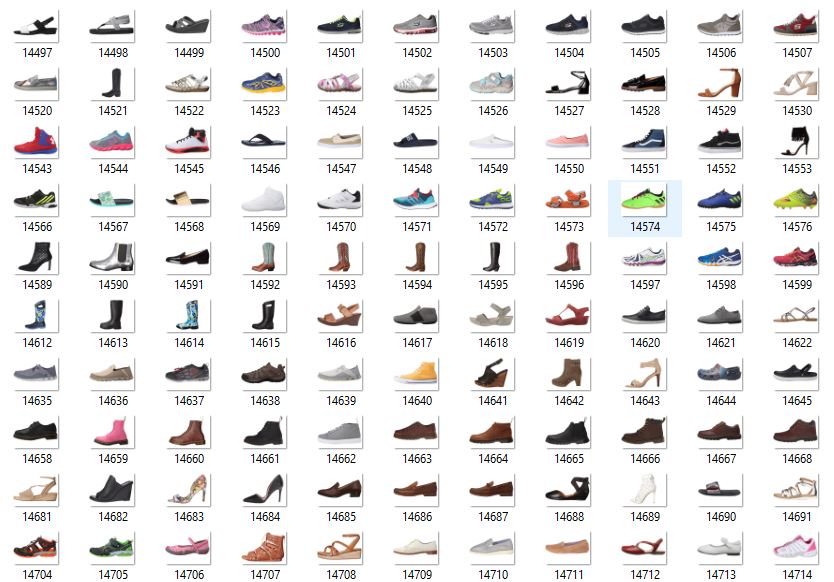
Figure 2: Sample of the >25,000 shoe images that have a white background and a side view with the toe pointing towards the left.
FEATURE EXTRACTION
The model consisted on extracting features from each image that describe the product. In this analysis we used a technique known as "Transfer Learning". The model that we used is a pre-trained Deep Learning Convolutional Neural Network. Specifically, we used the VGG16 architecture with the Image Net weights. This implementation was extracted from Keras (Python) using a TensorFlow backend.
Each image was resized to 224 x 224 x 3 pixels so it could be placed thru the VGG16 architecture. We extracted 4,096 features from the last fully connected layer (before the Softmax layer), as shown in Figure 3.
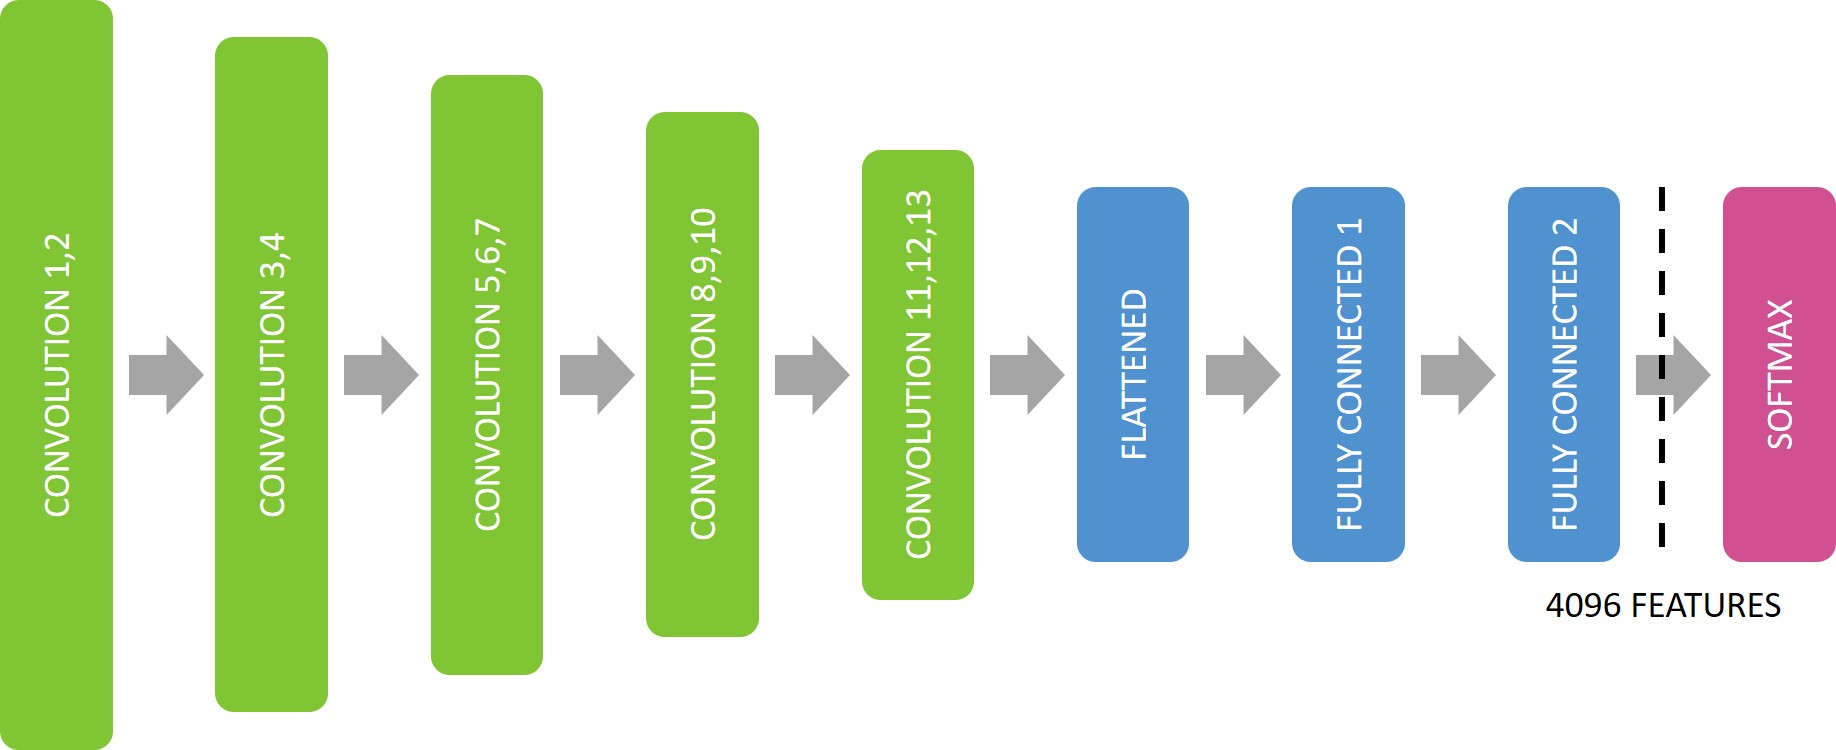
Figure 3: Pre-Trained VGG16 Architecture with ImageNet, indicating the last fully connected layer where we extract 4096 features for each image.
SIMILARITY ANALYSIS
To determine the similarity between two images, we used a K-Nearest Neighbors approach using the 4,096 features extracted from the VGG16 model as input values. We calculated the Euclidean distance between the features from every pair of images for the whole dataset. For a given input image, the three images that had the smallest distance were the recommended images.
PRODUCT RECOMMENDATIONS
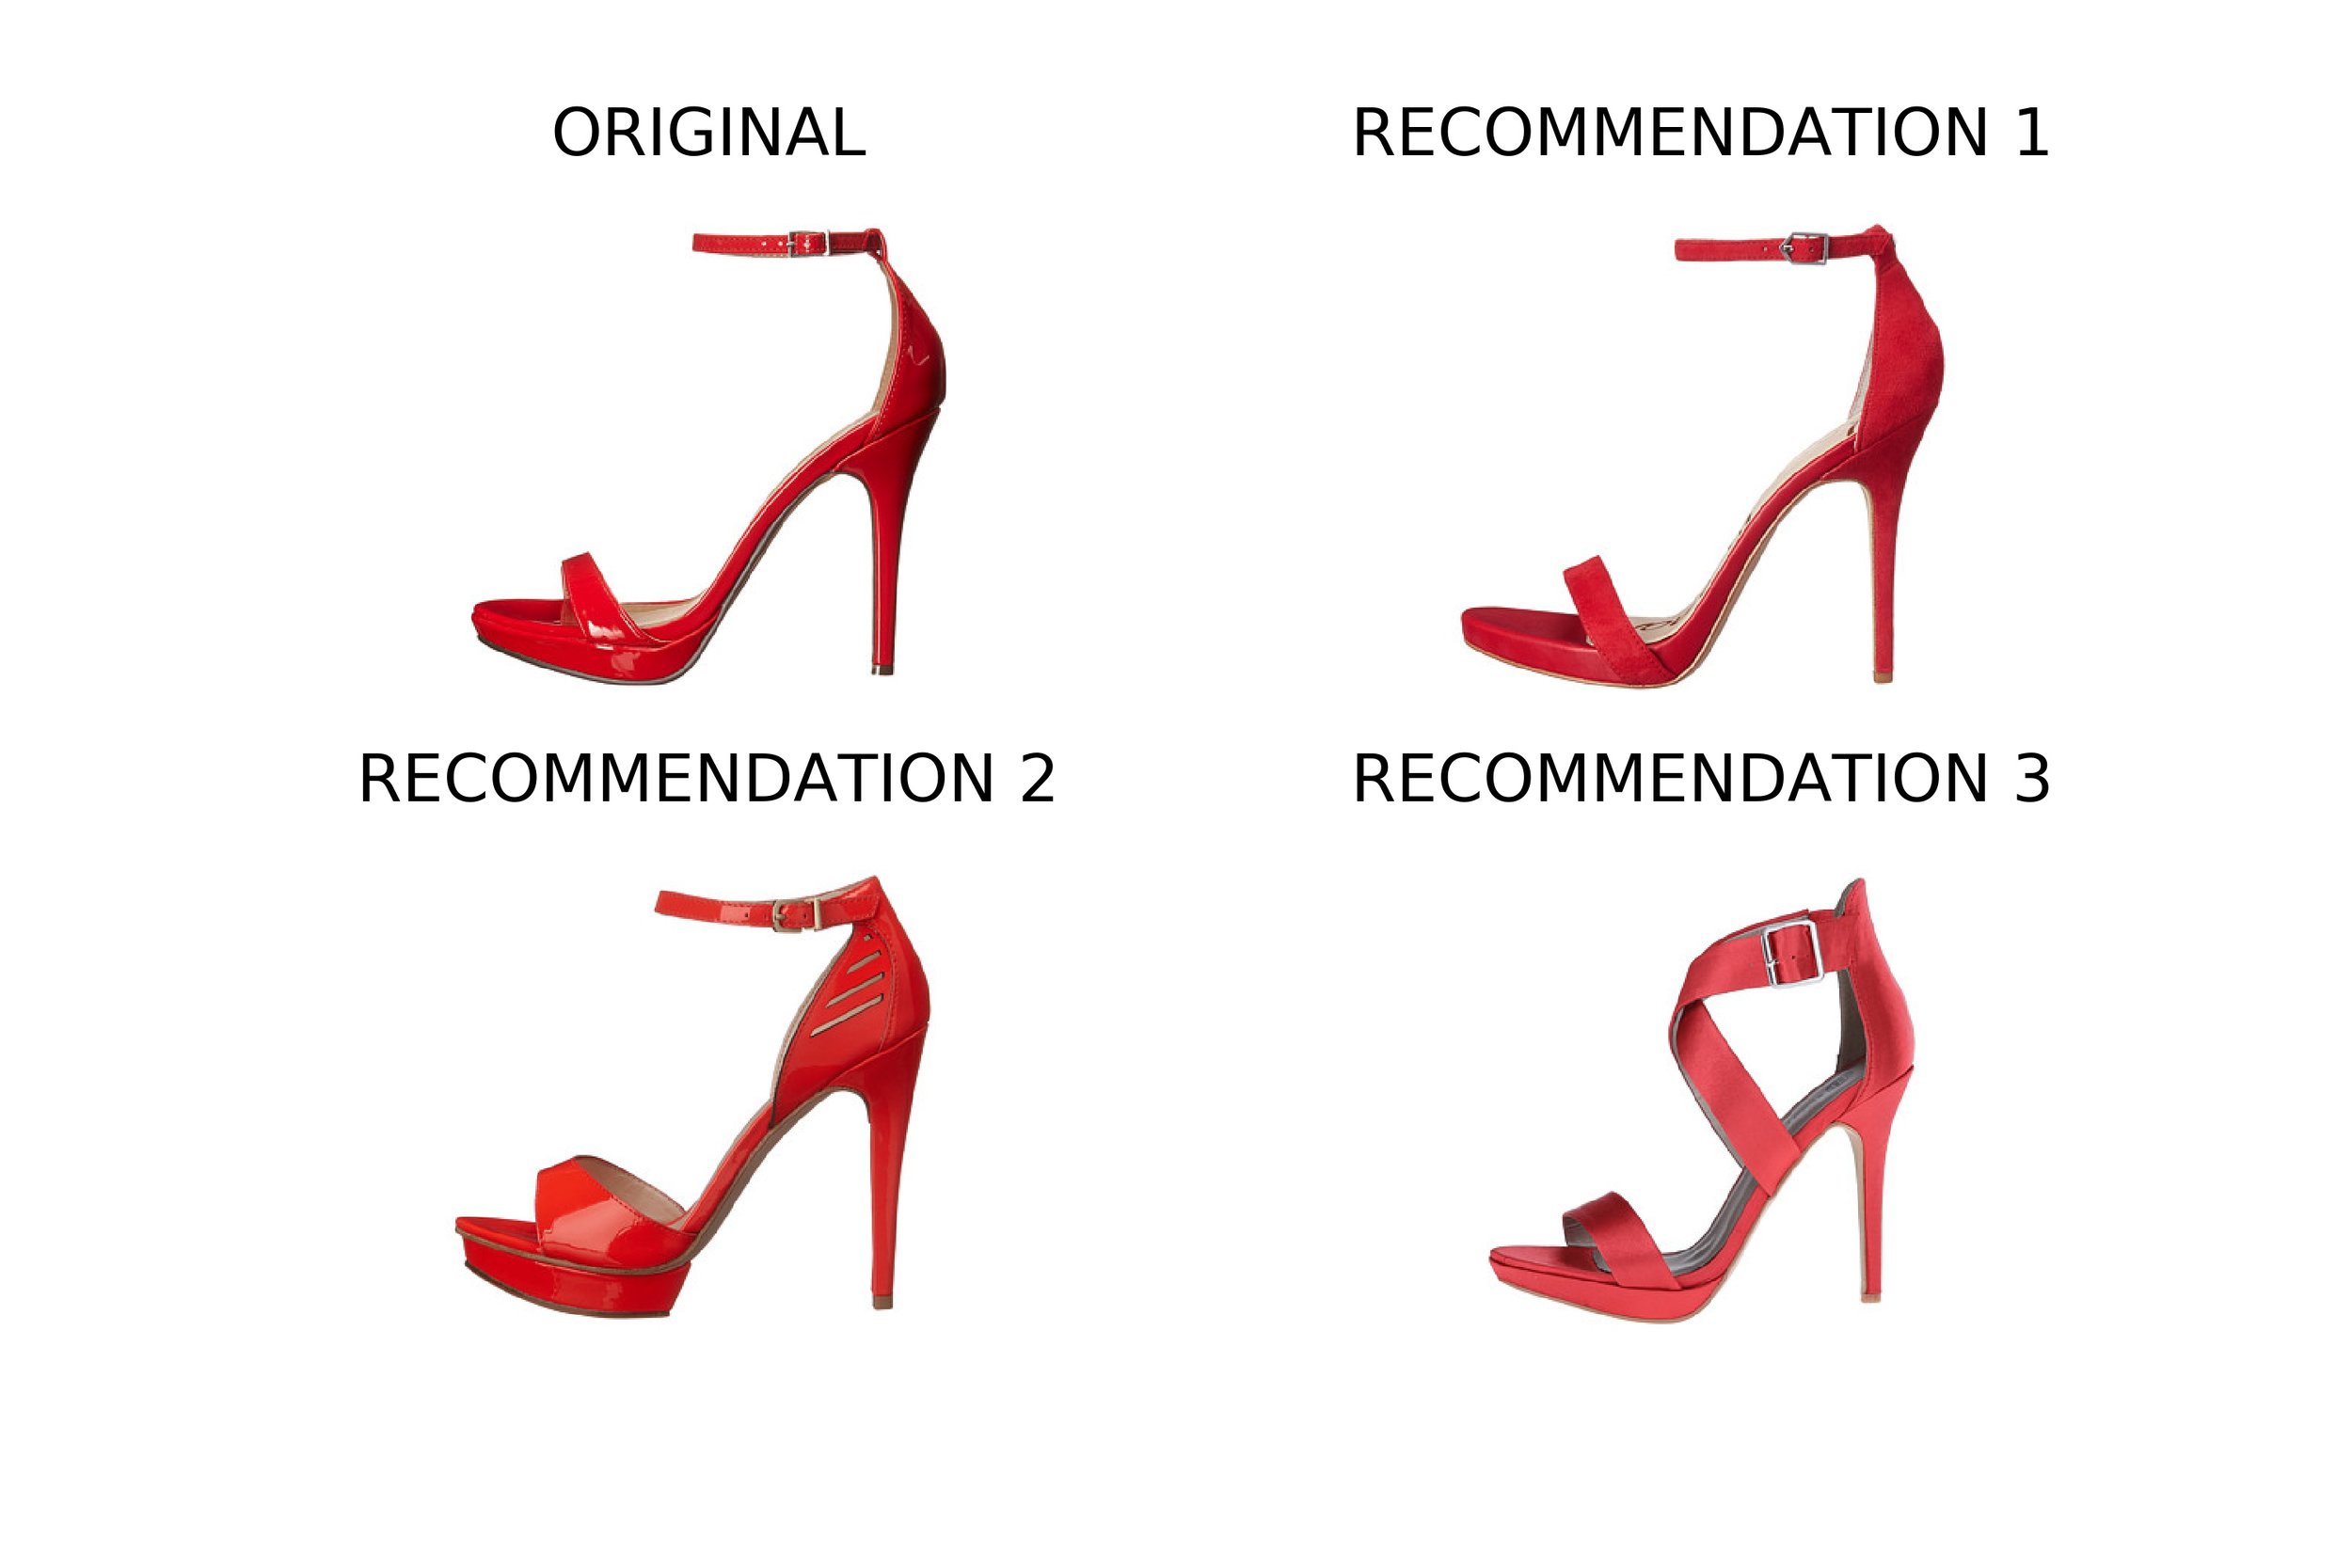
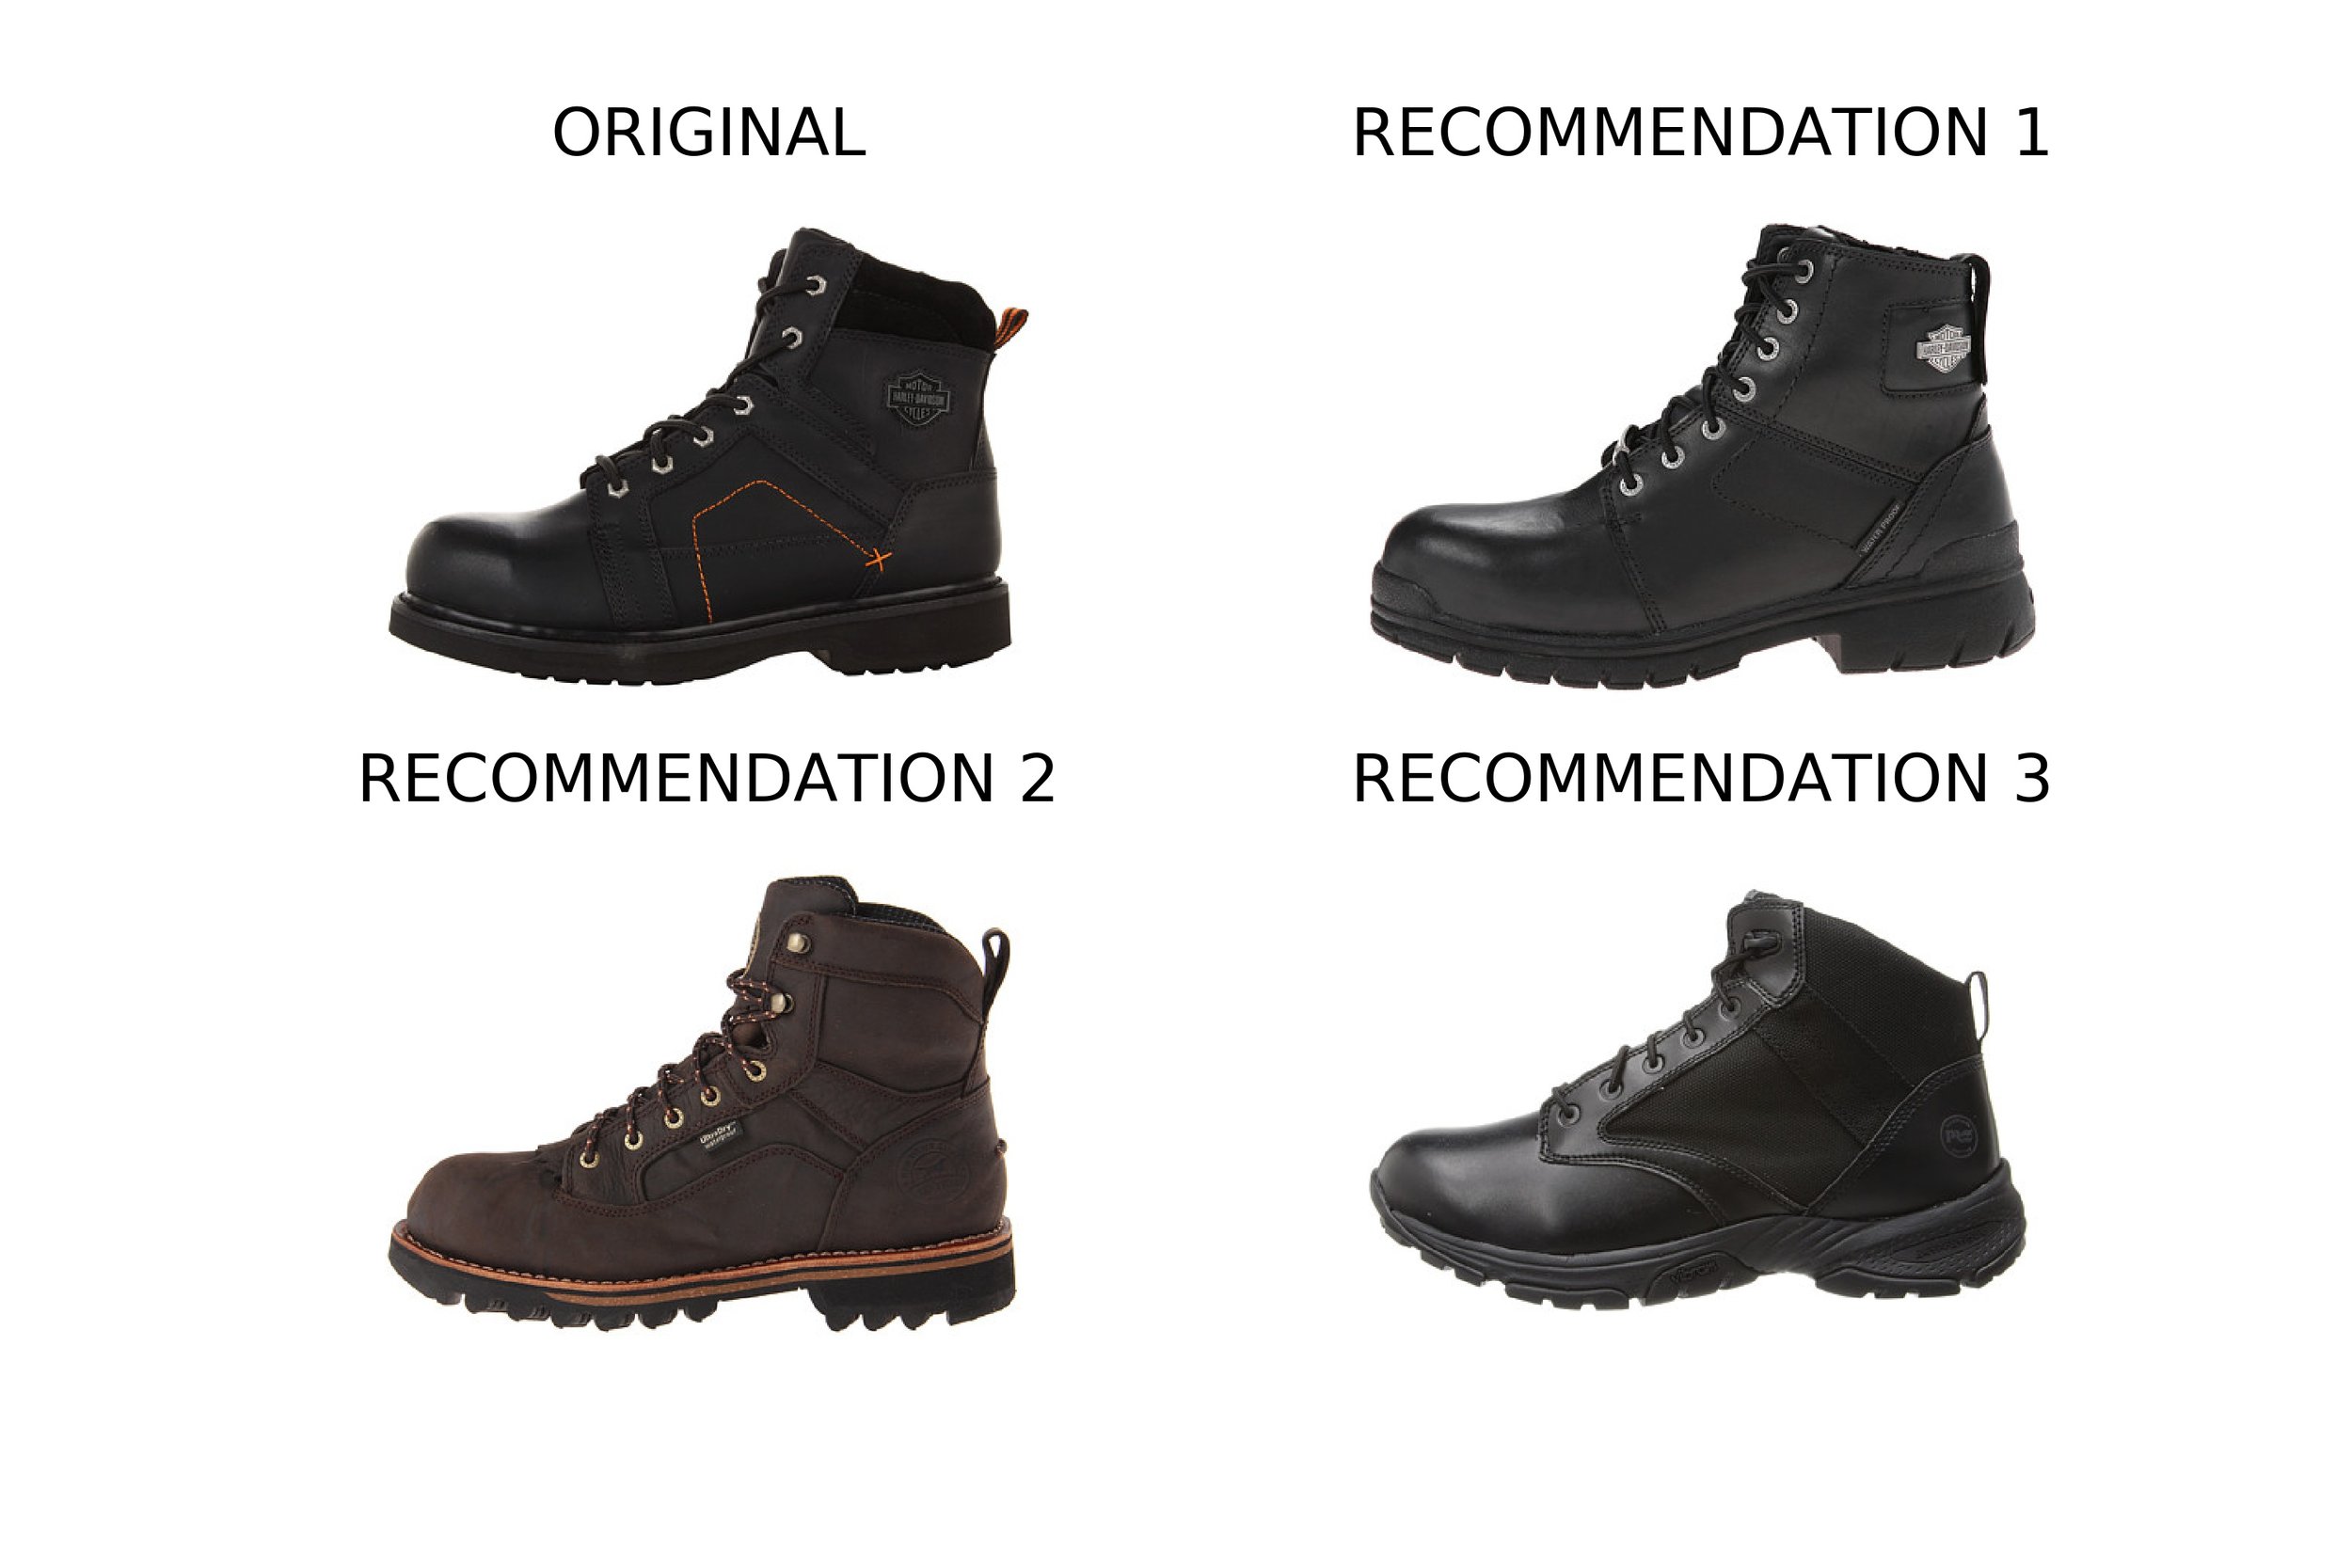
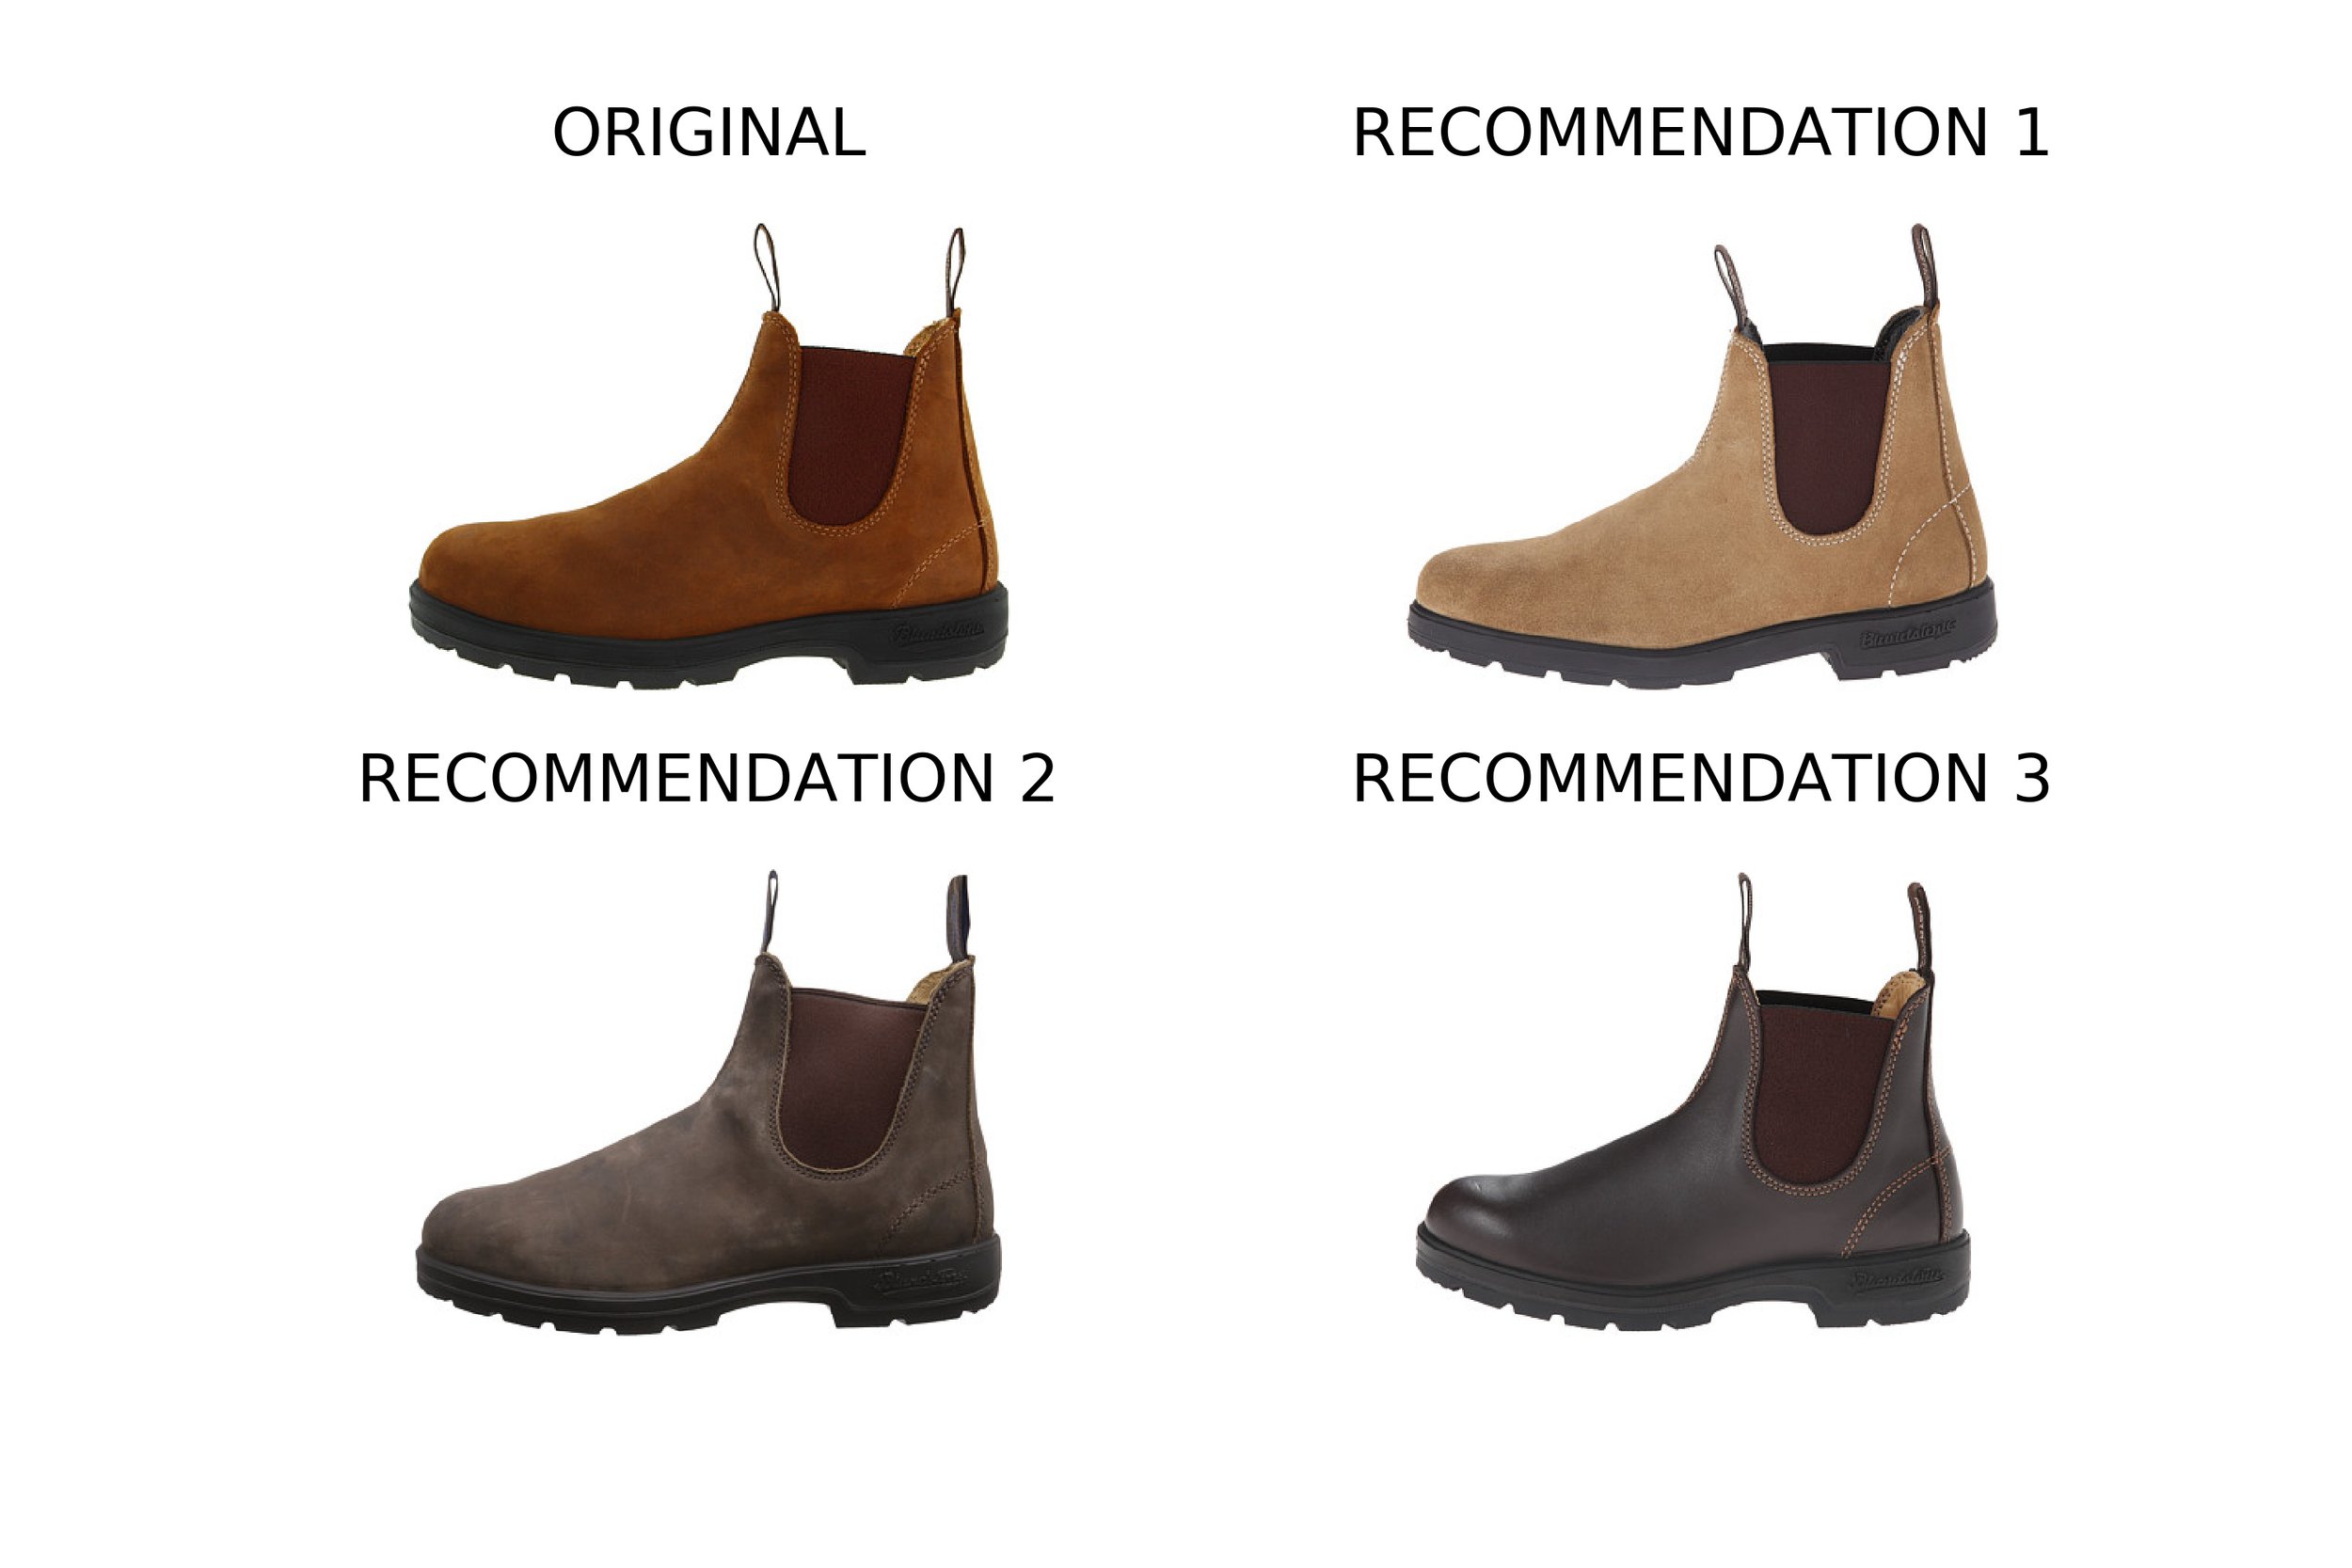
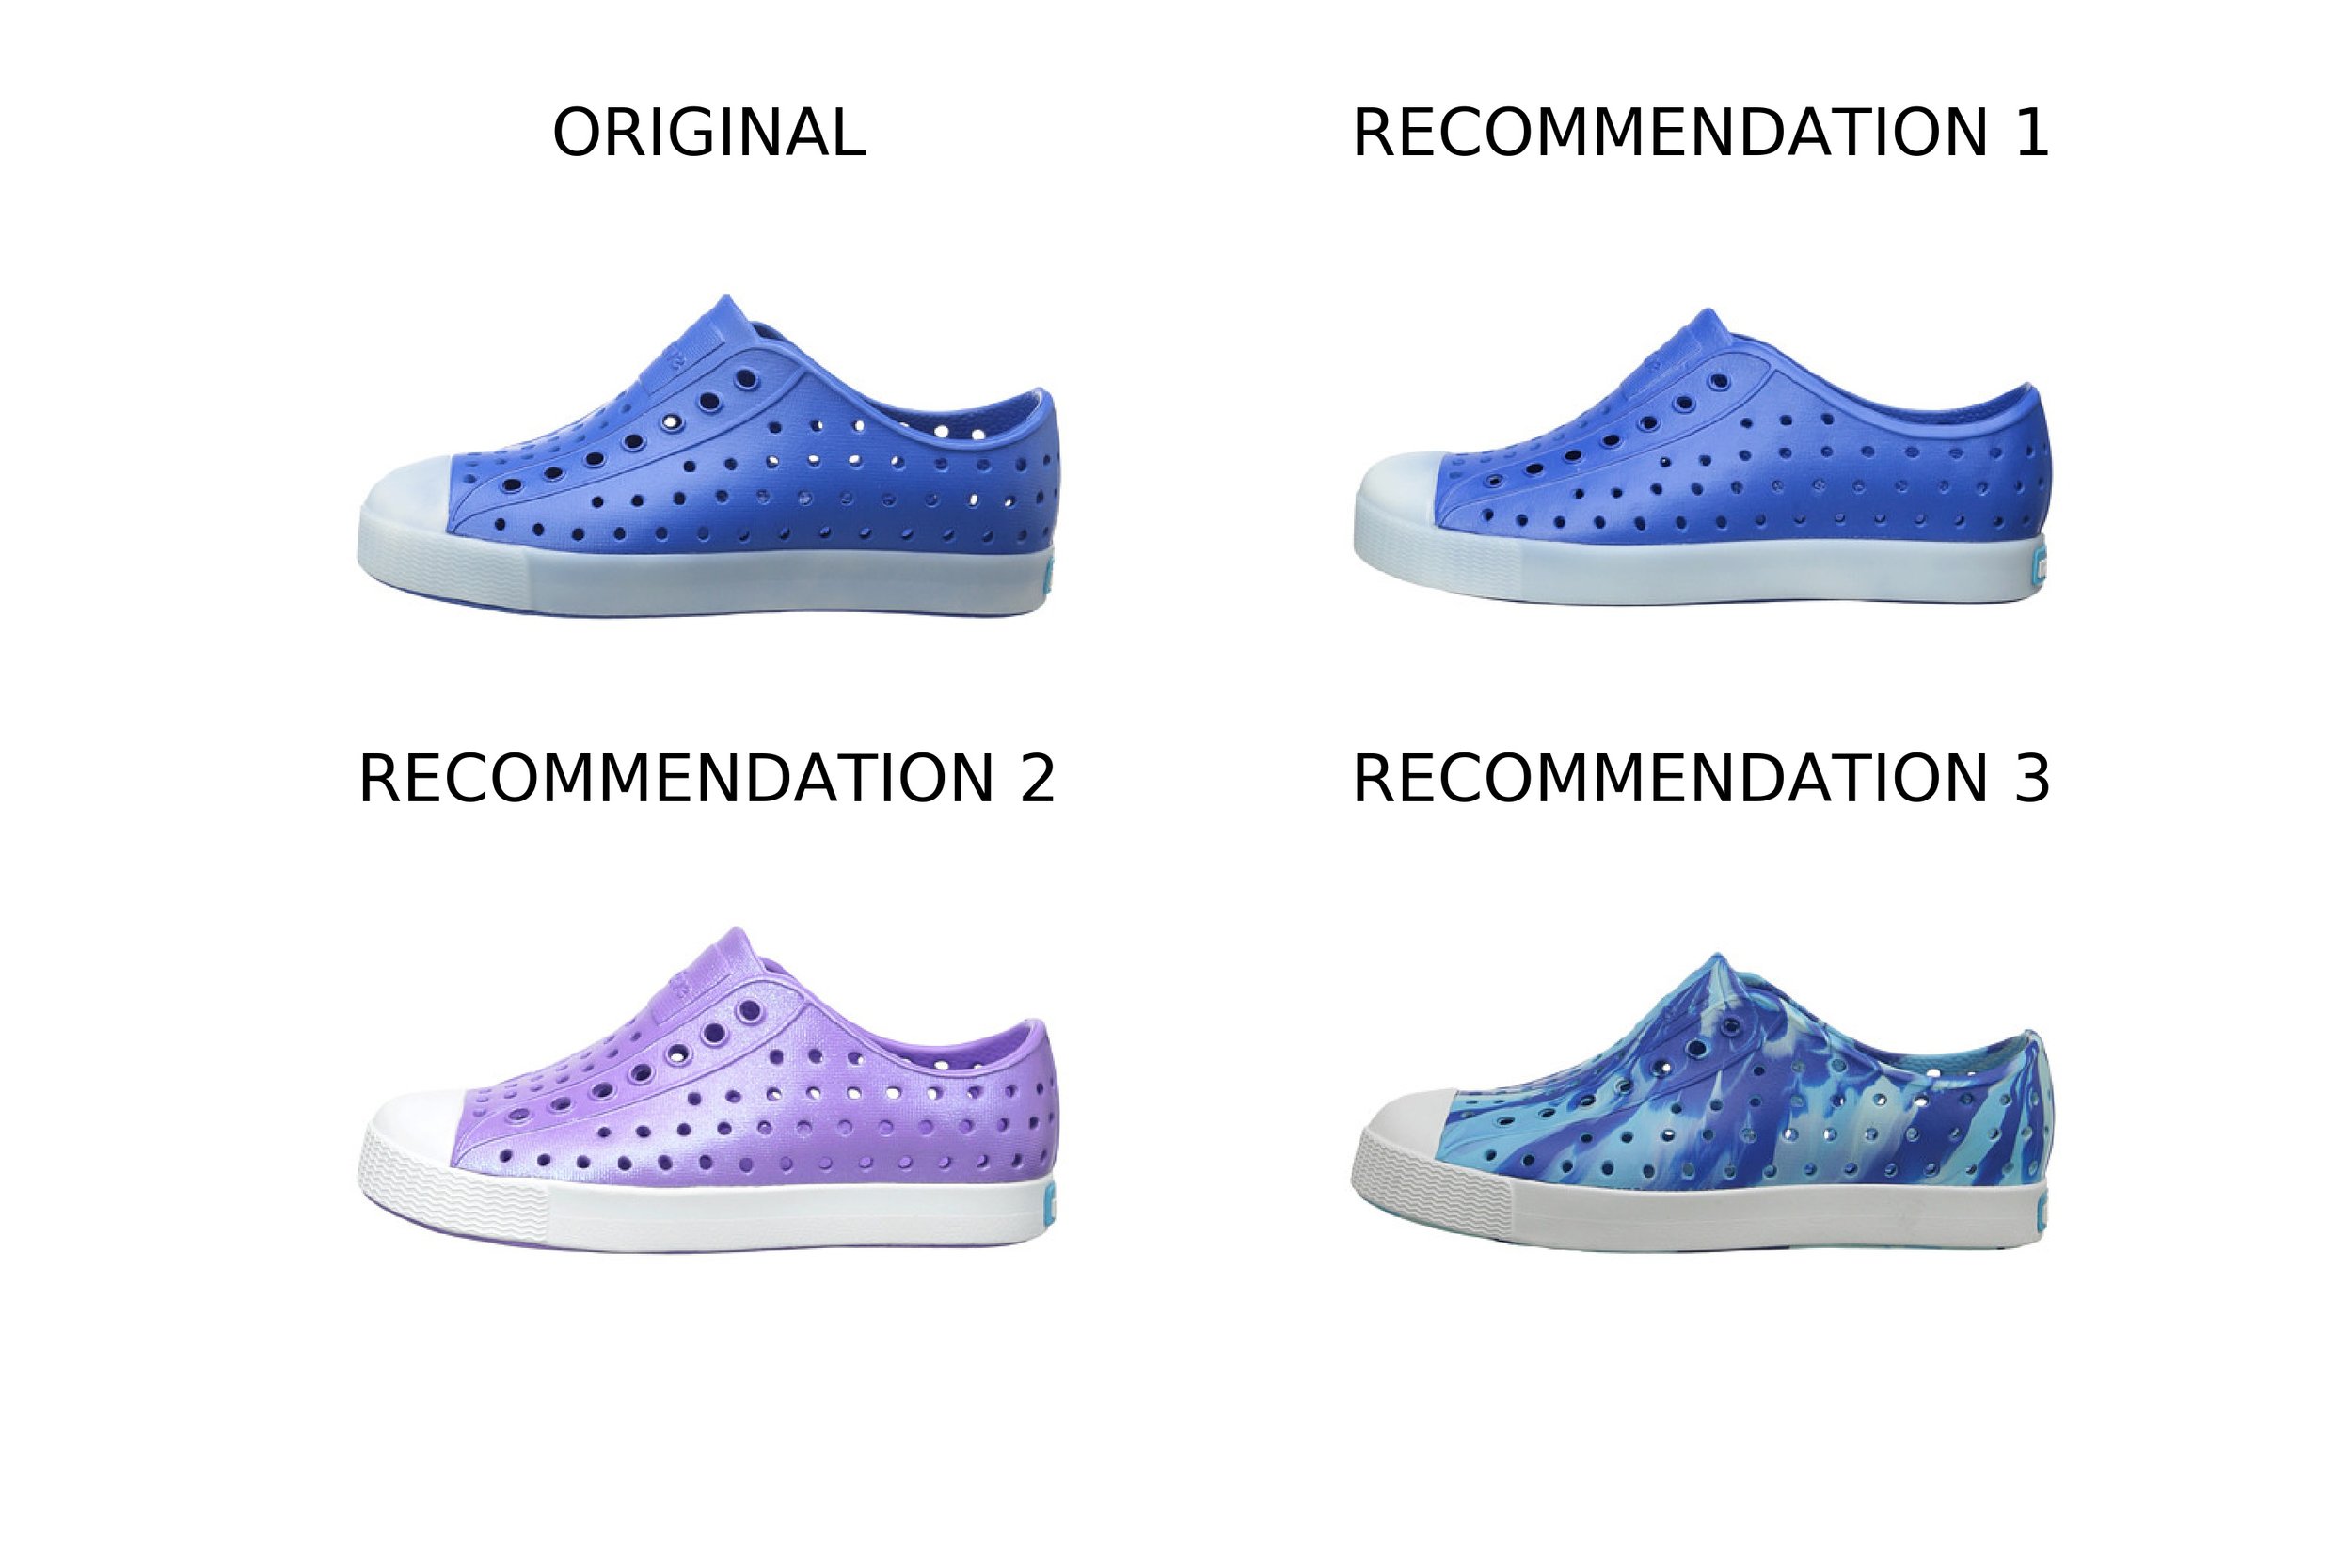
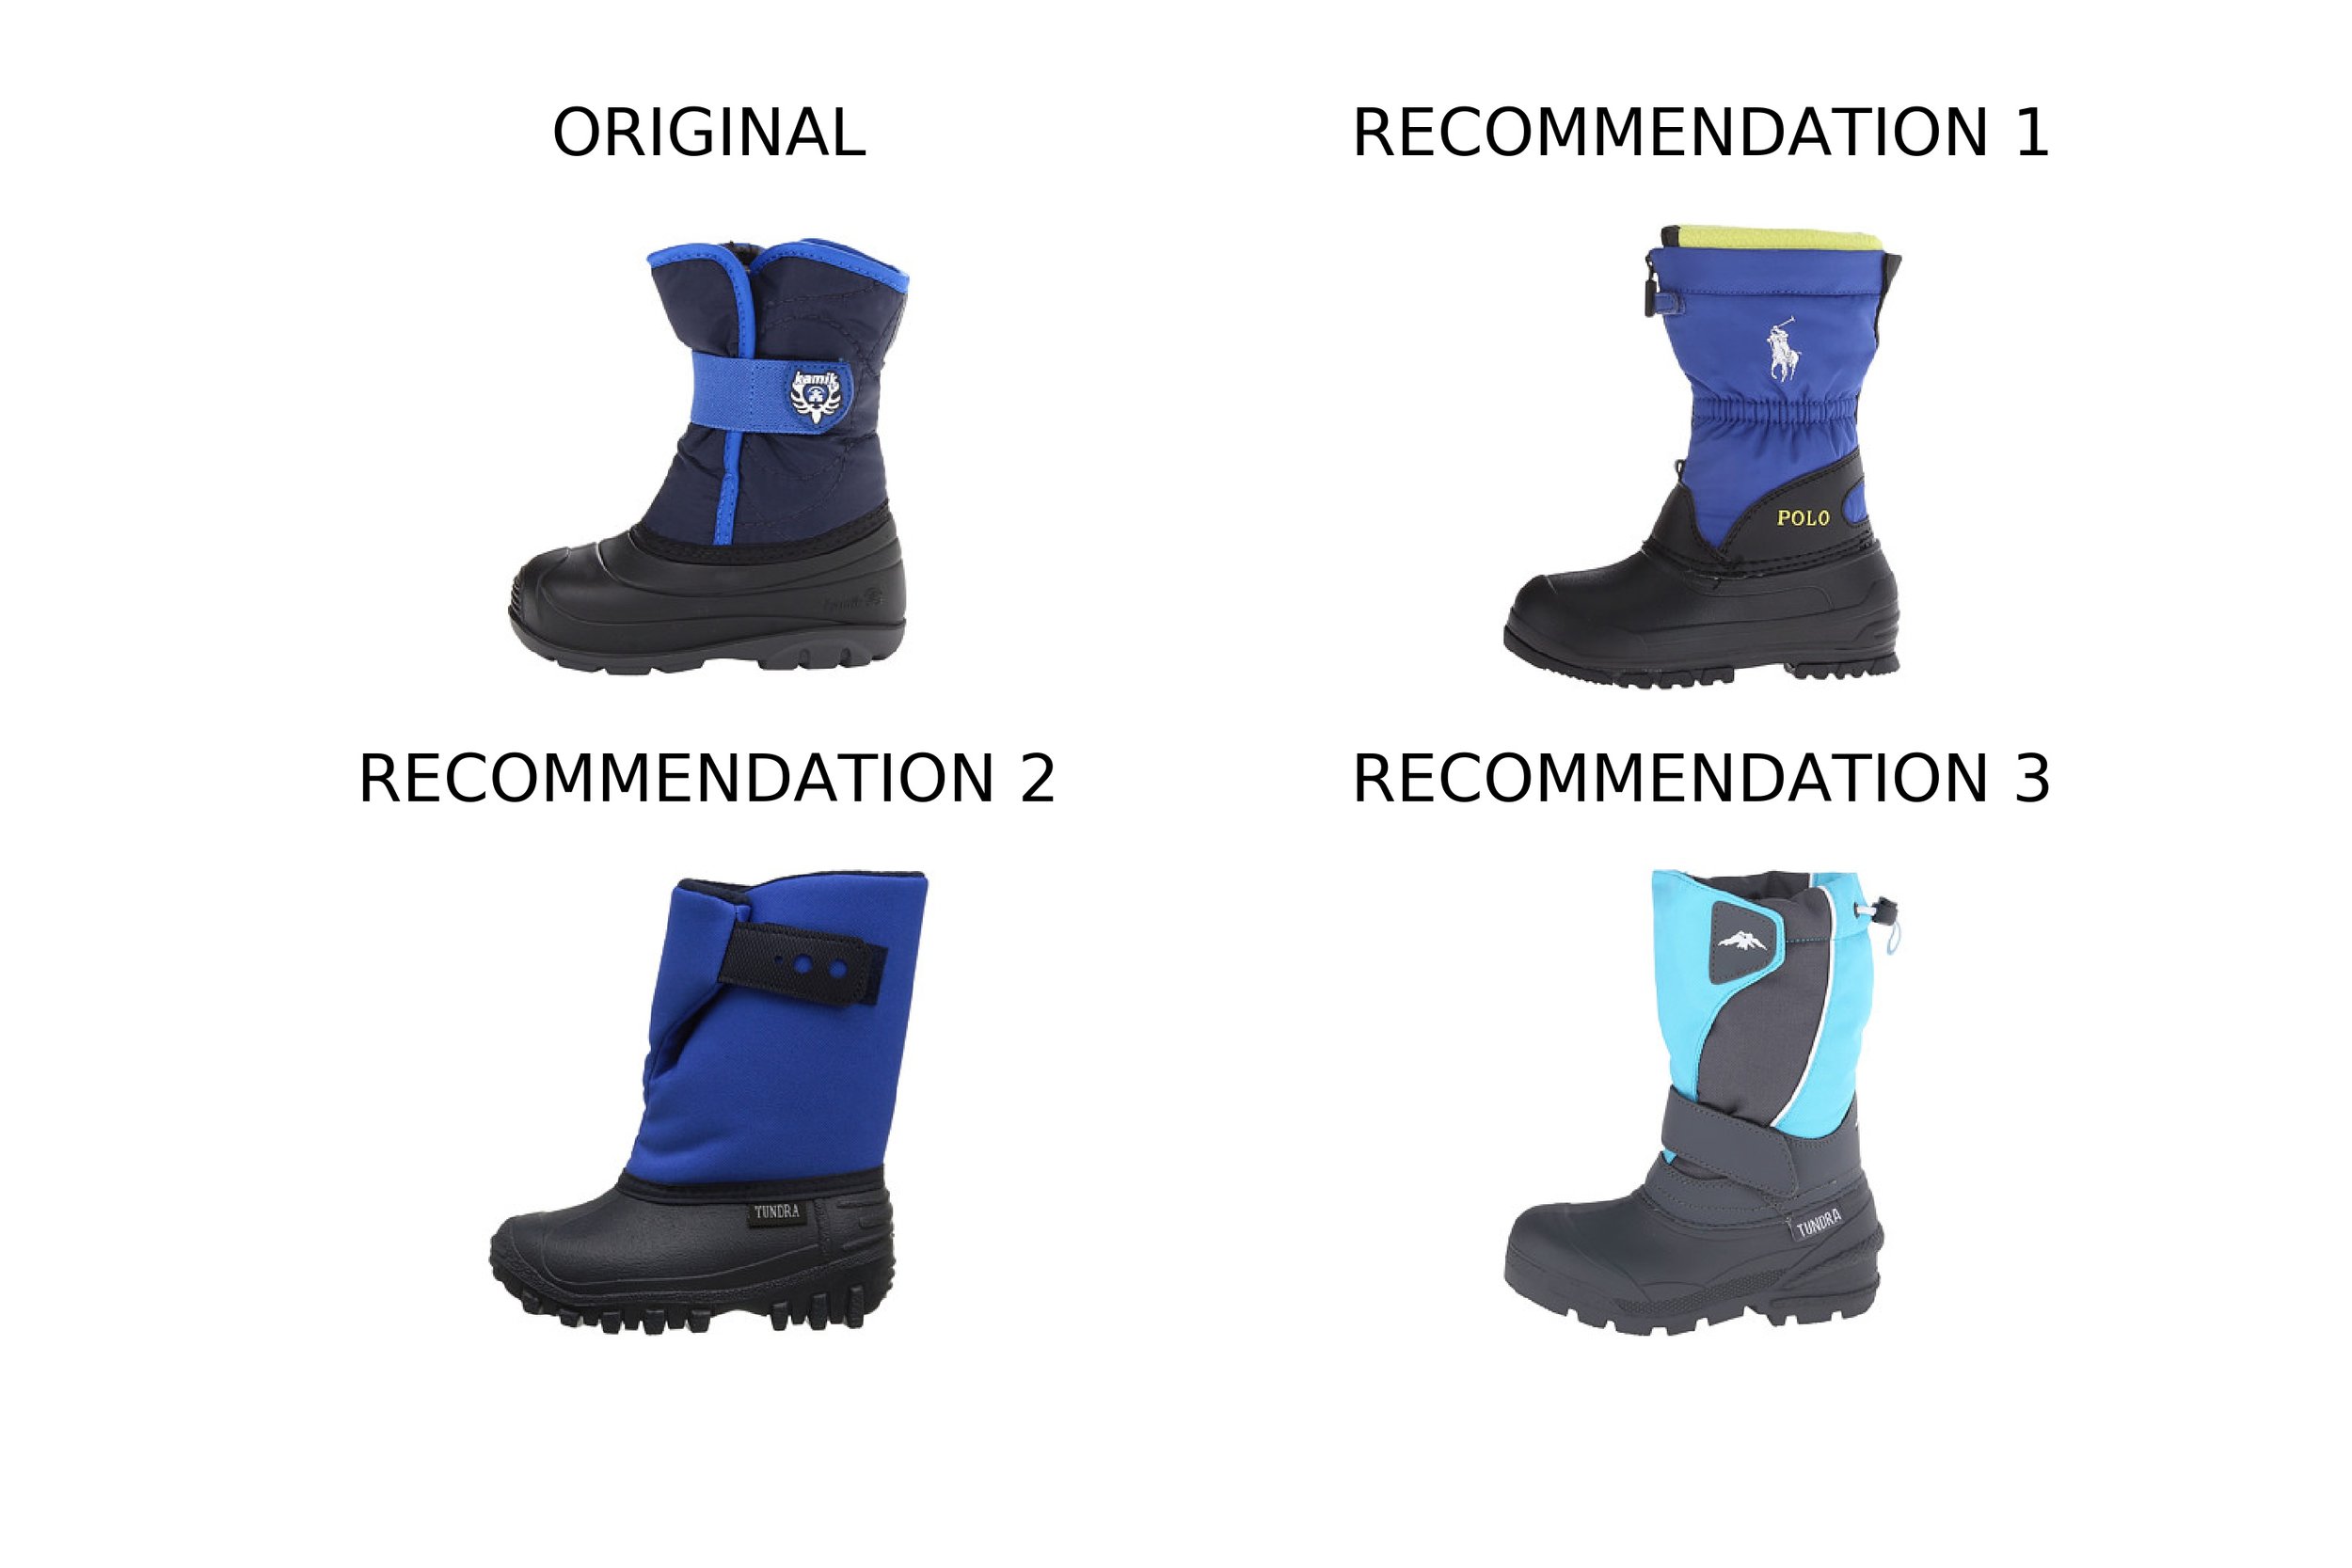
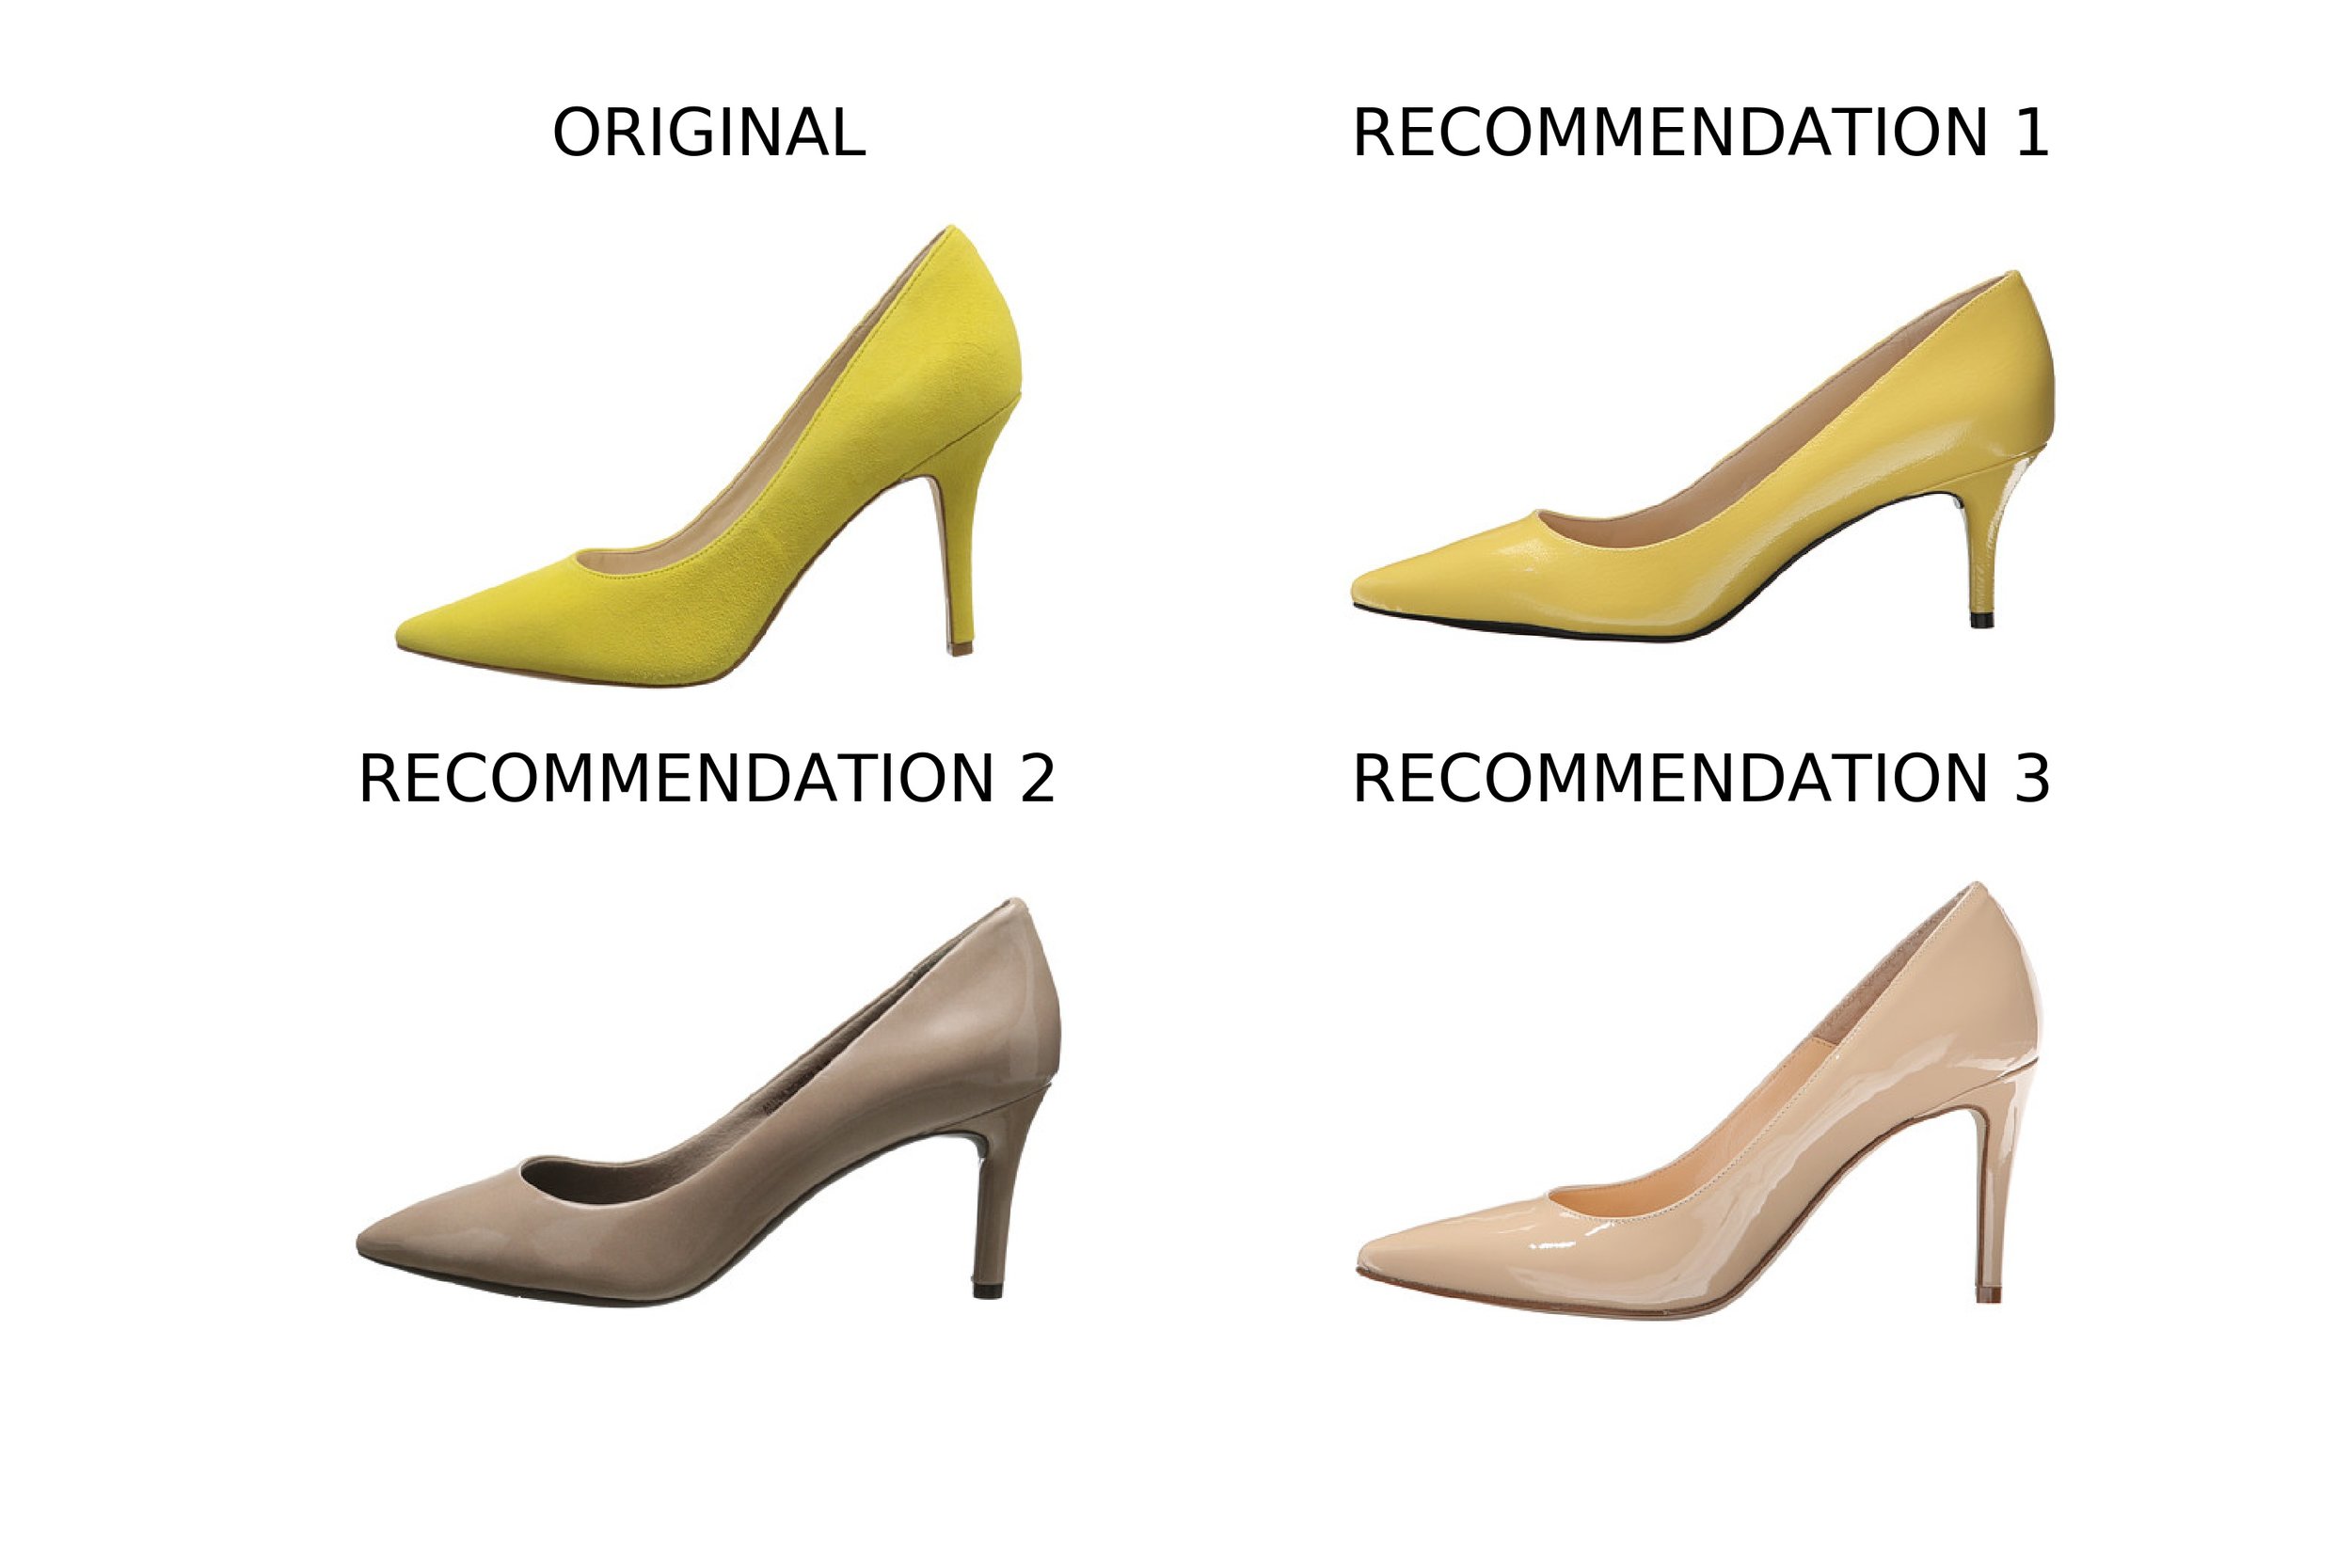
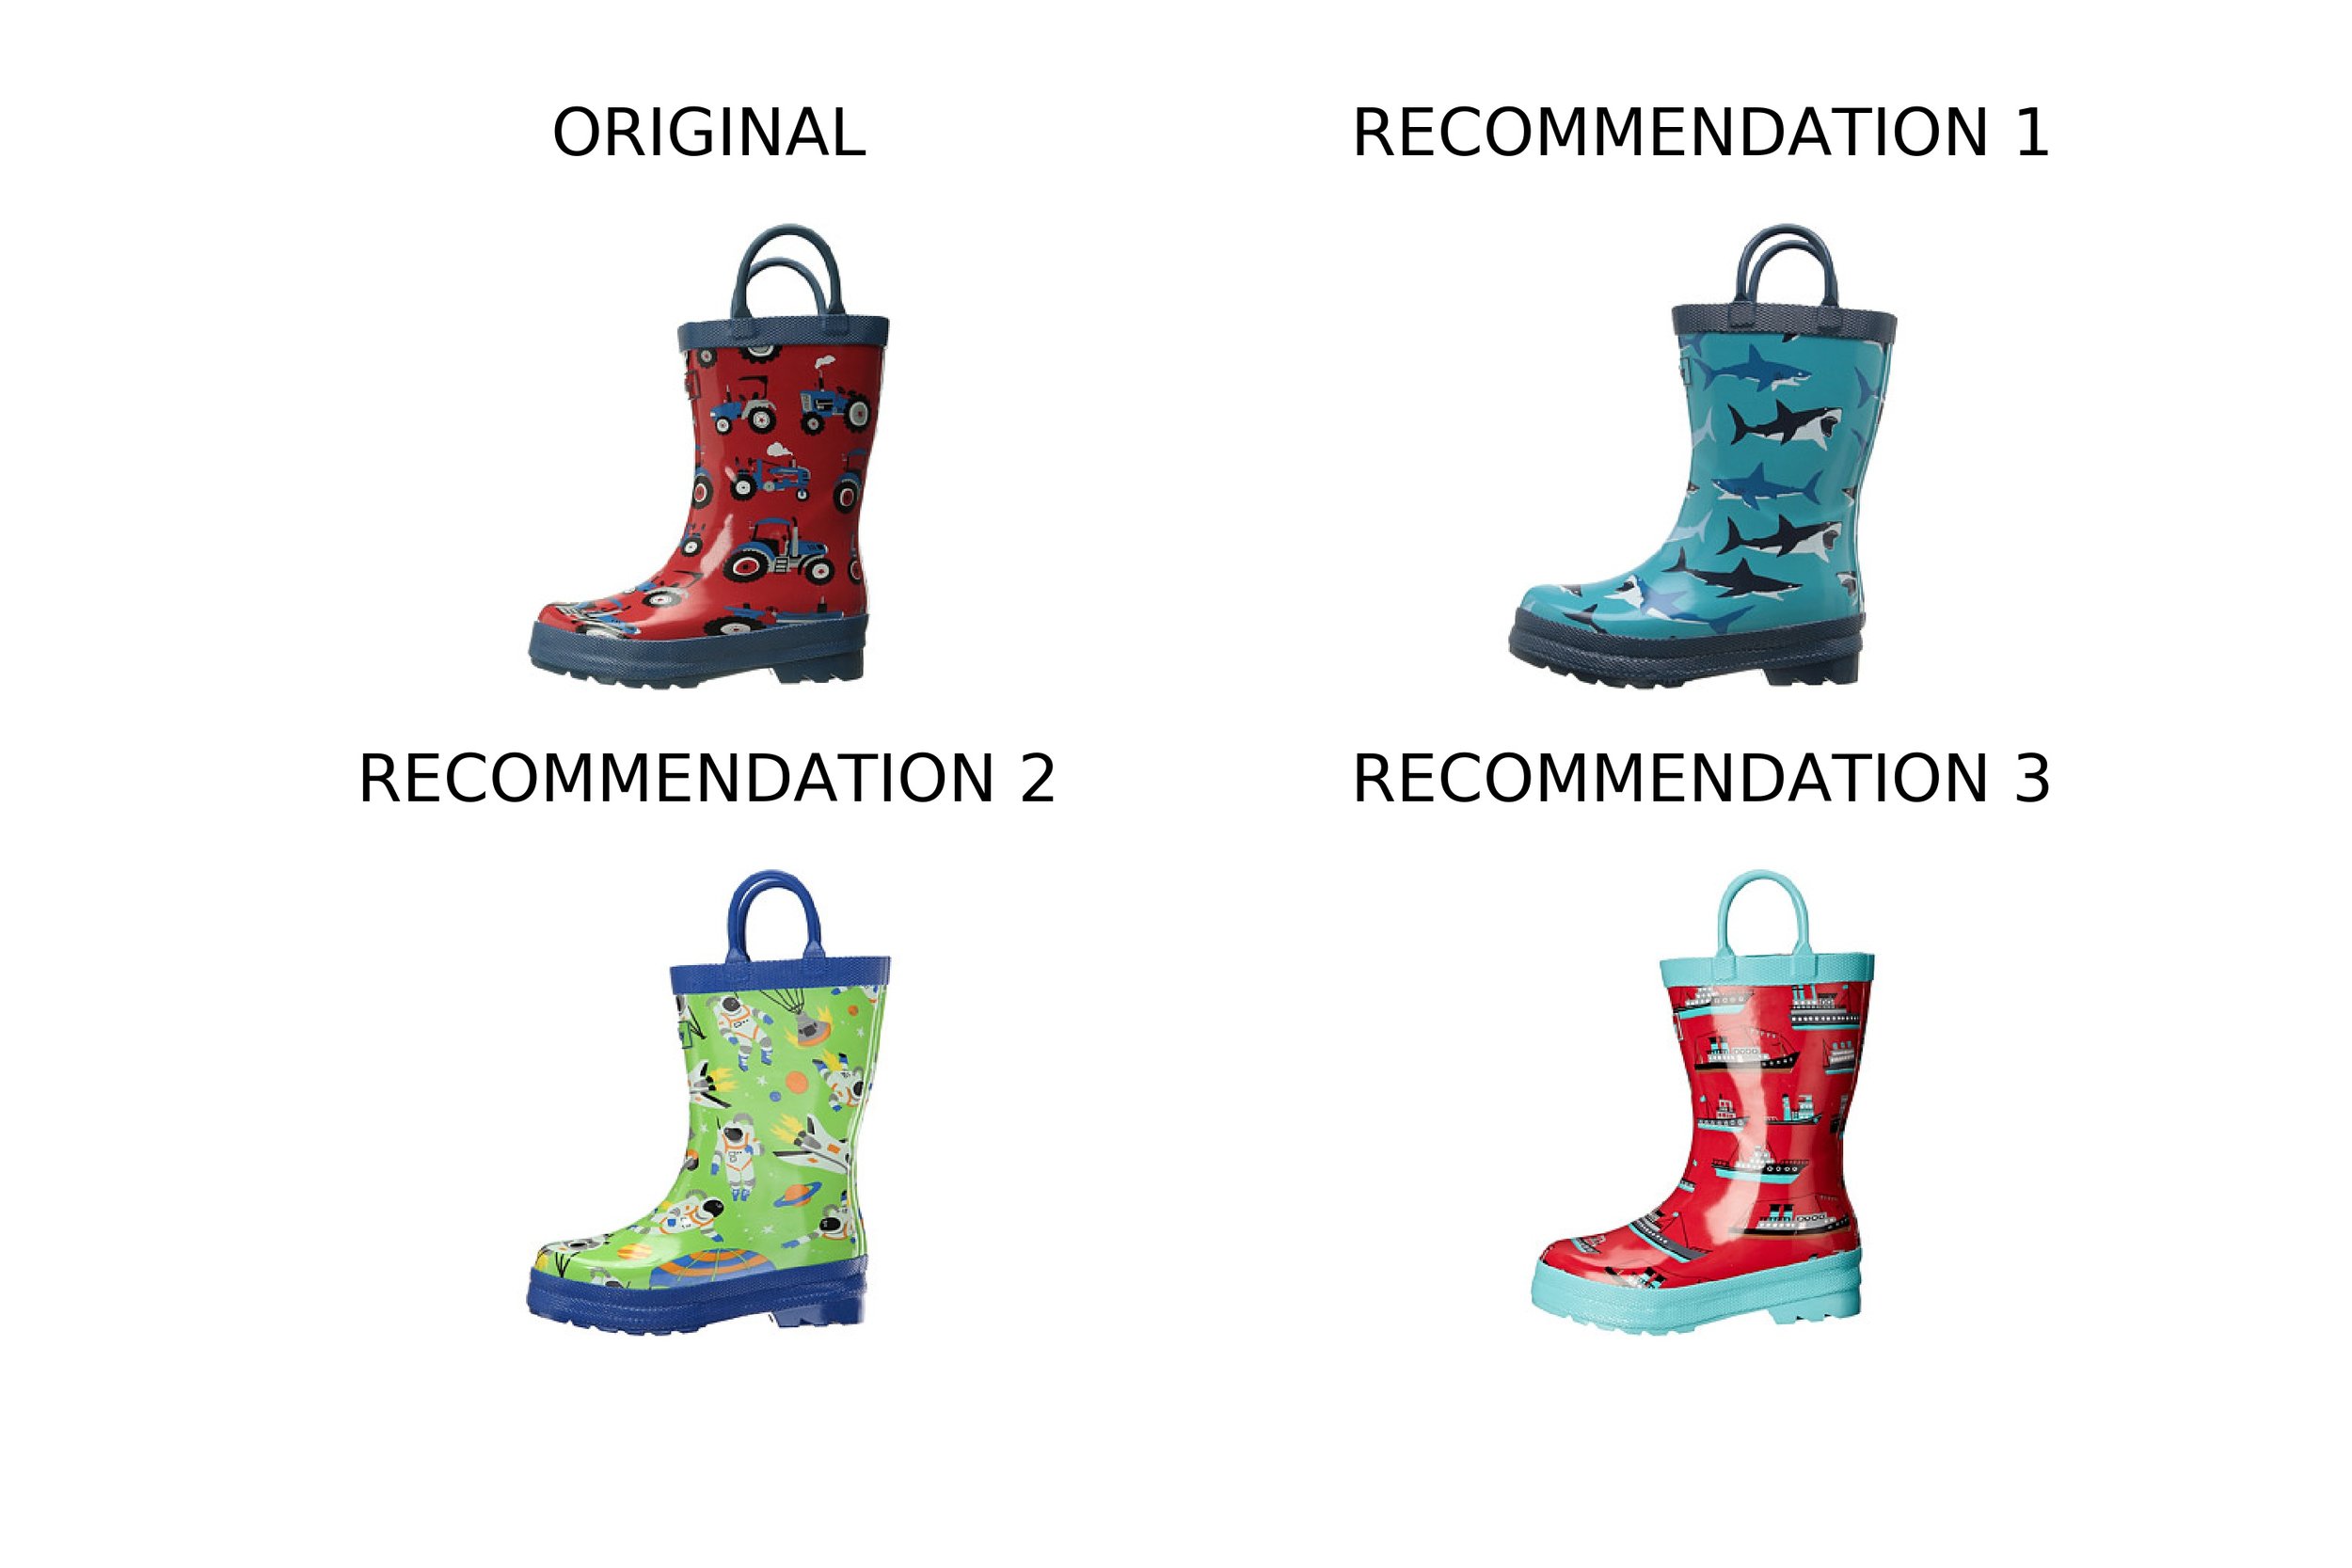
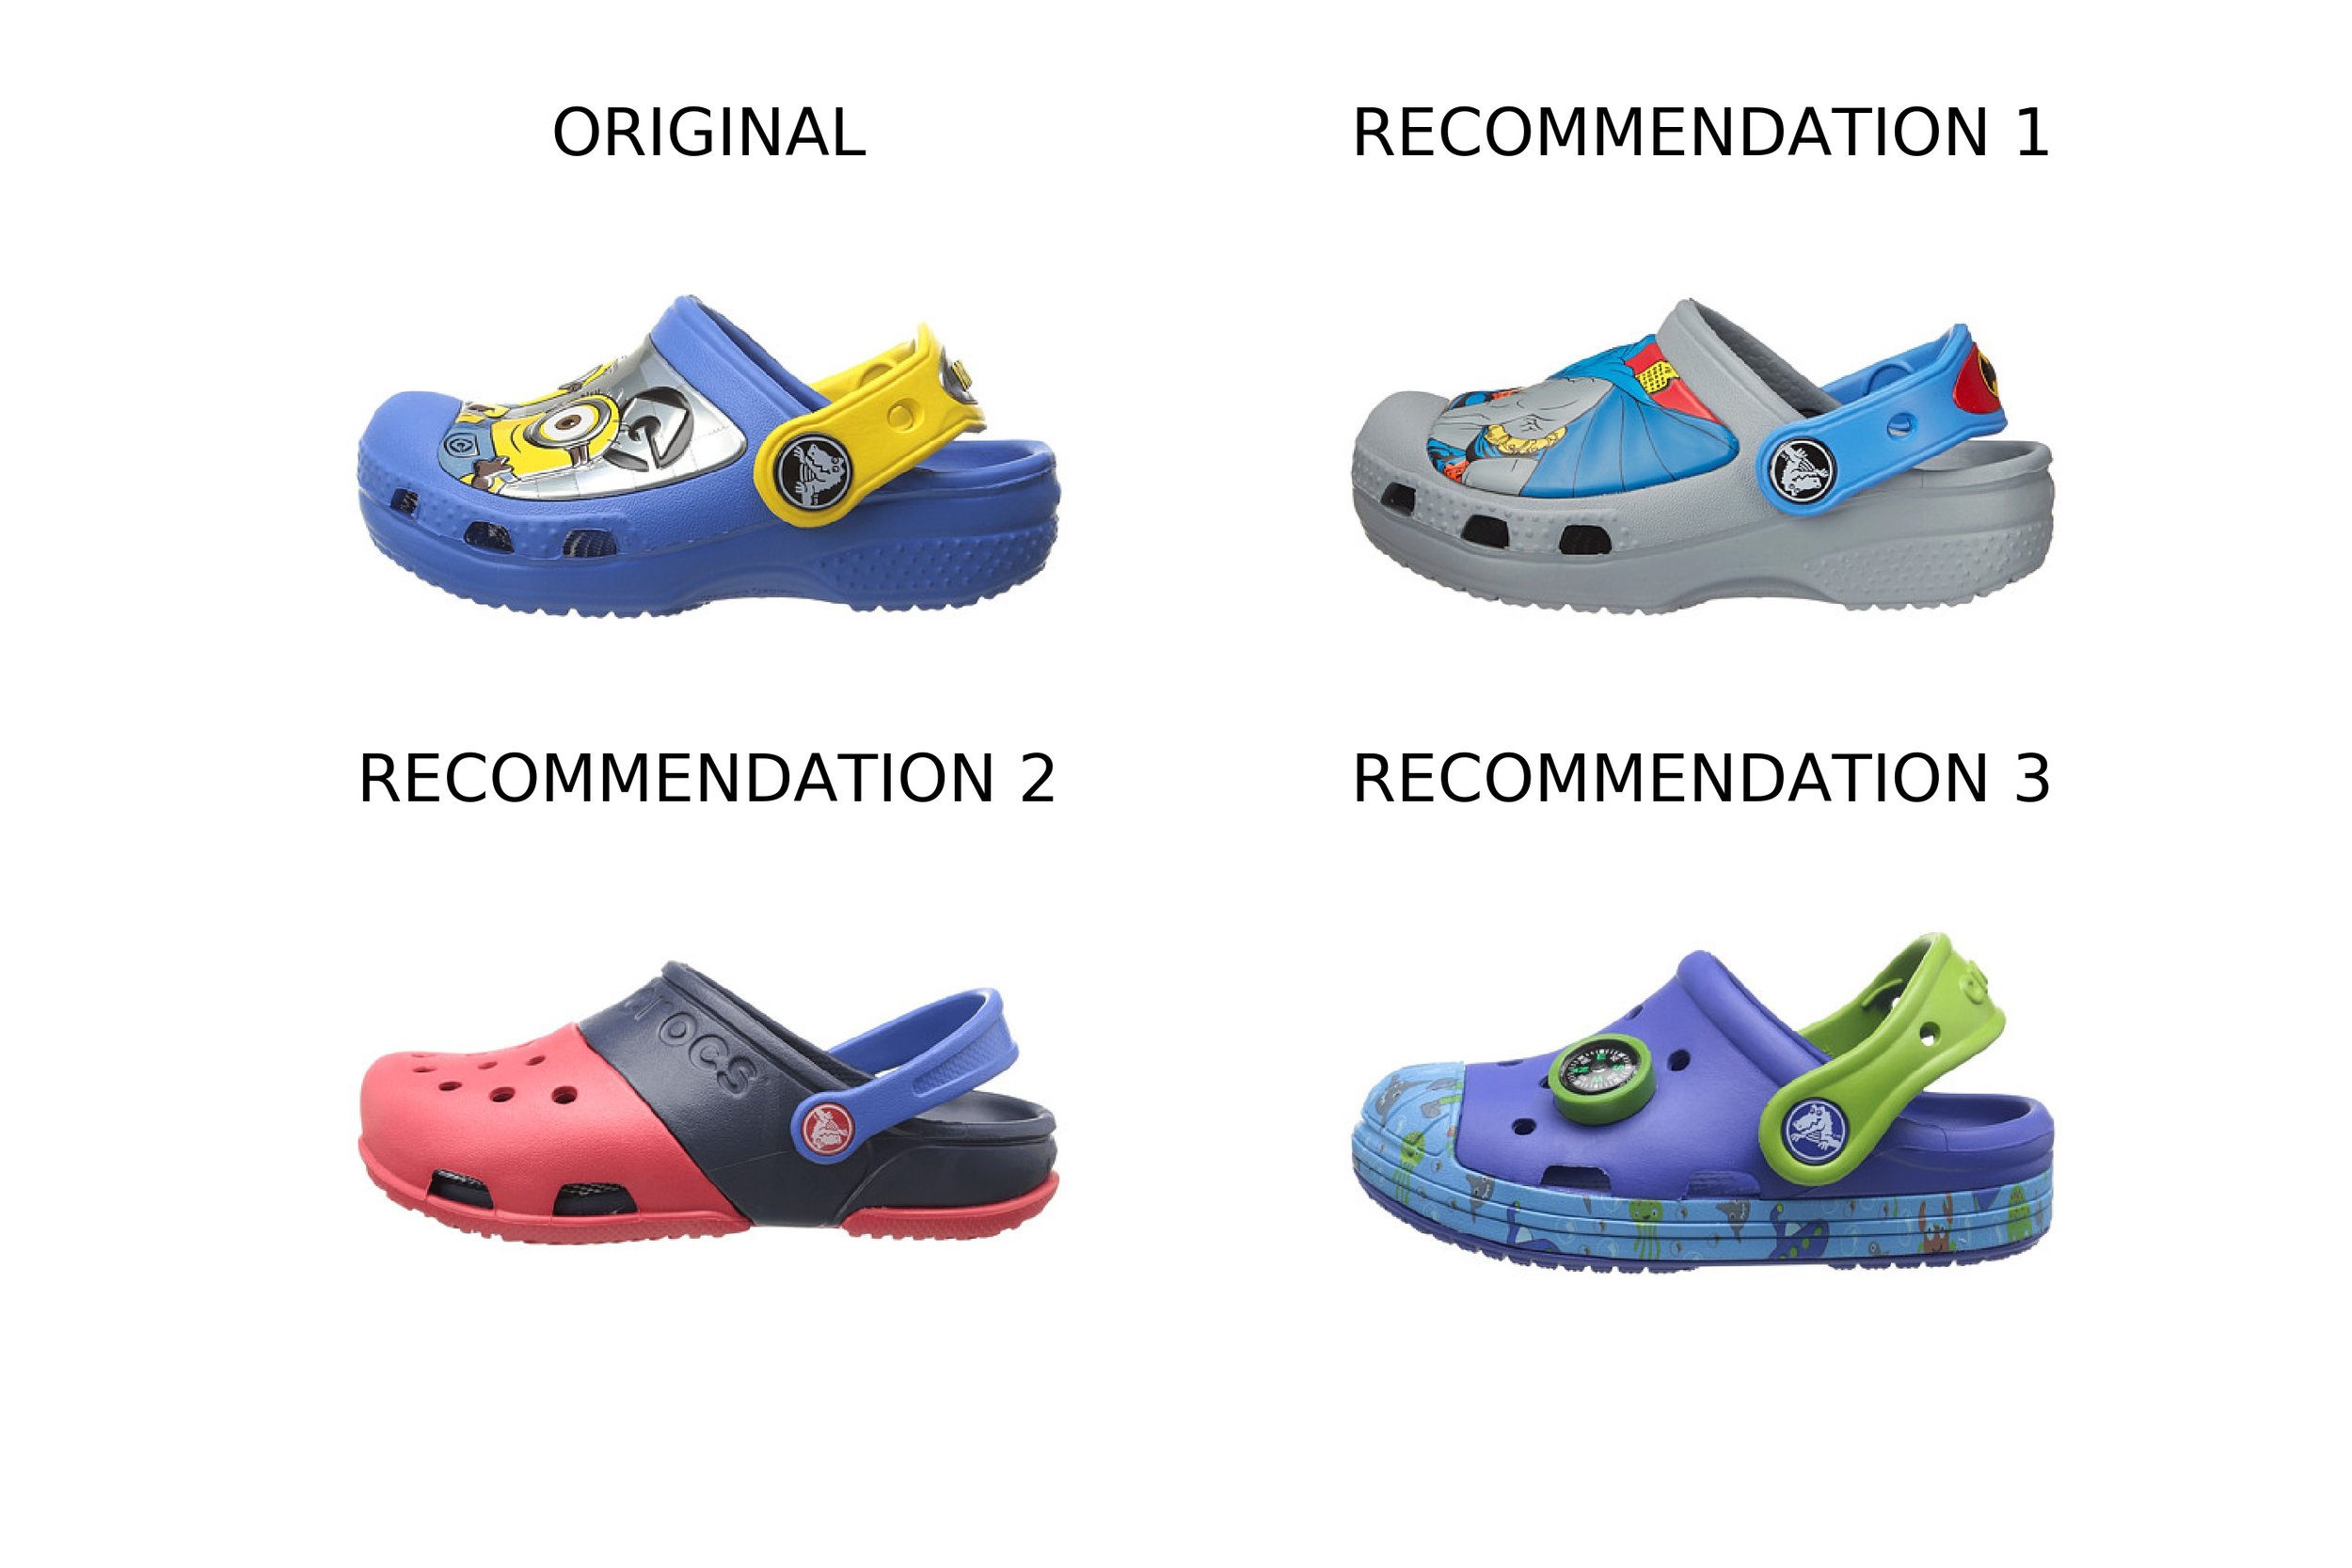
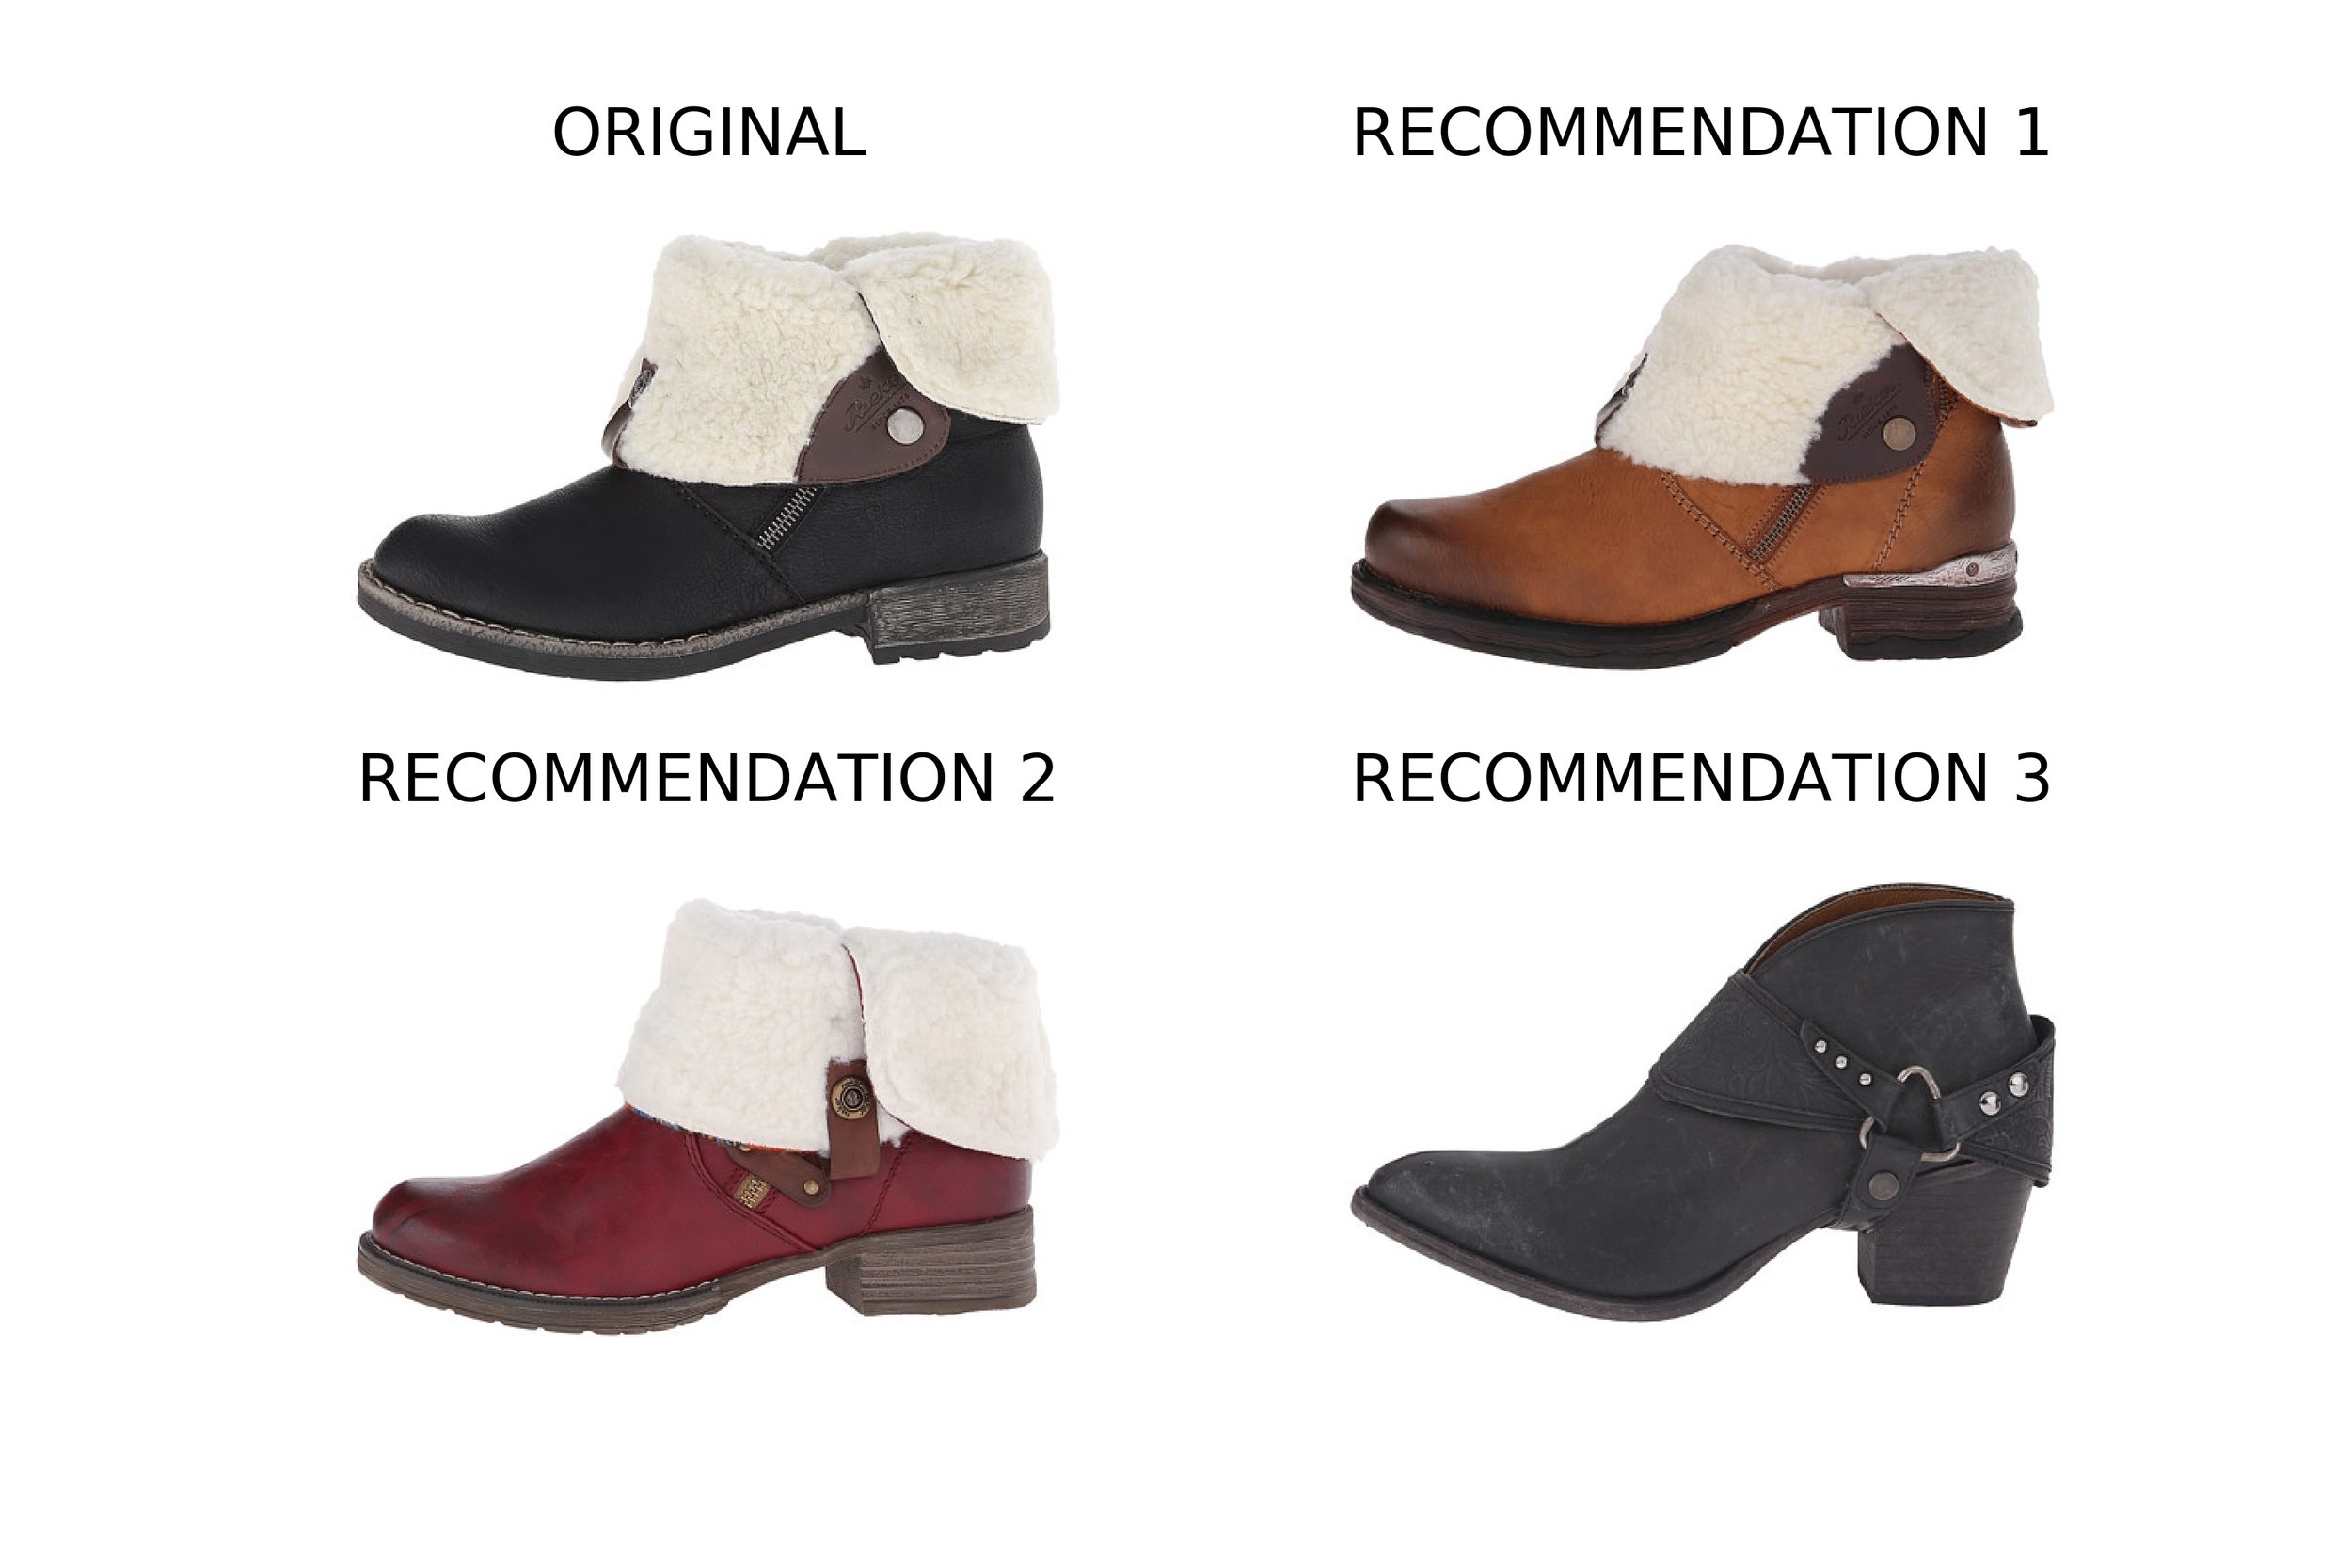
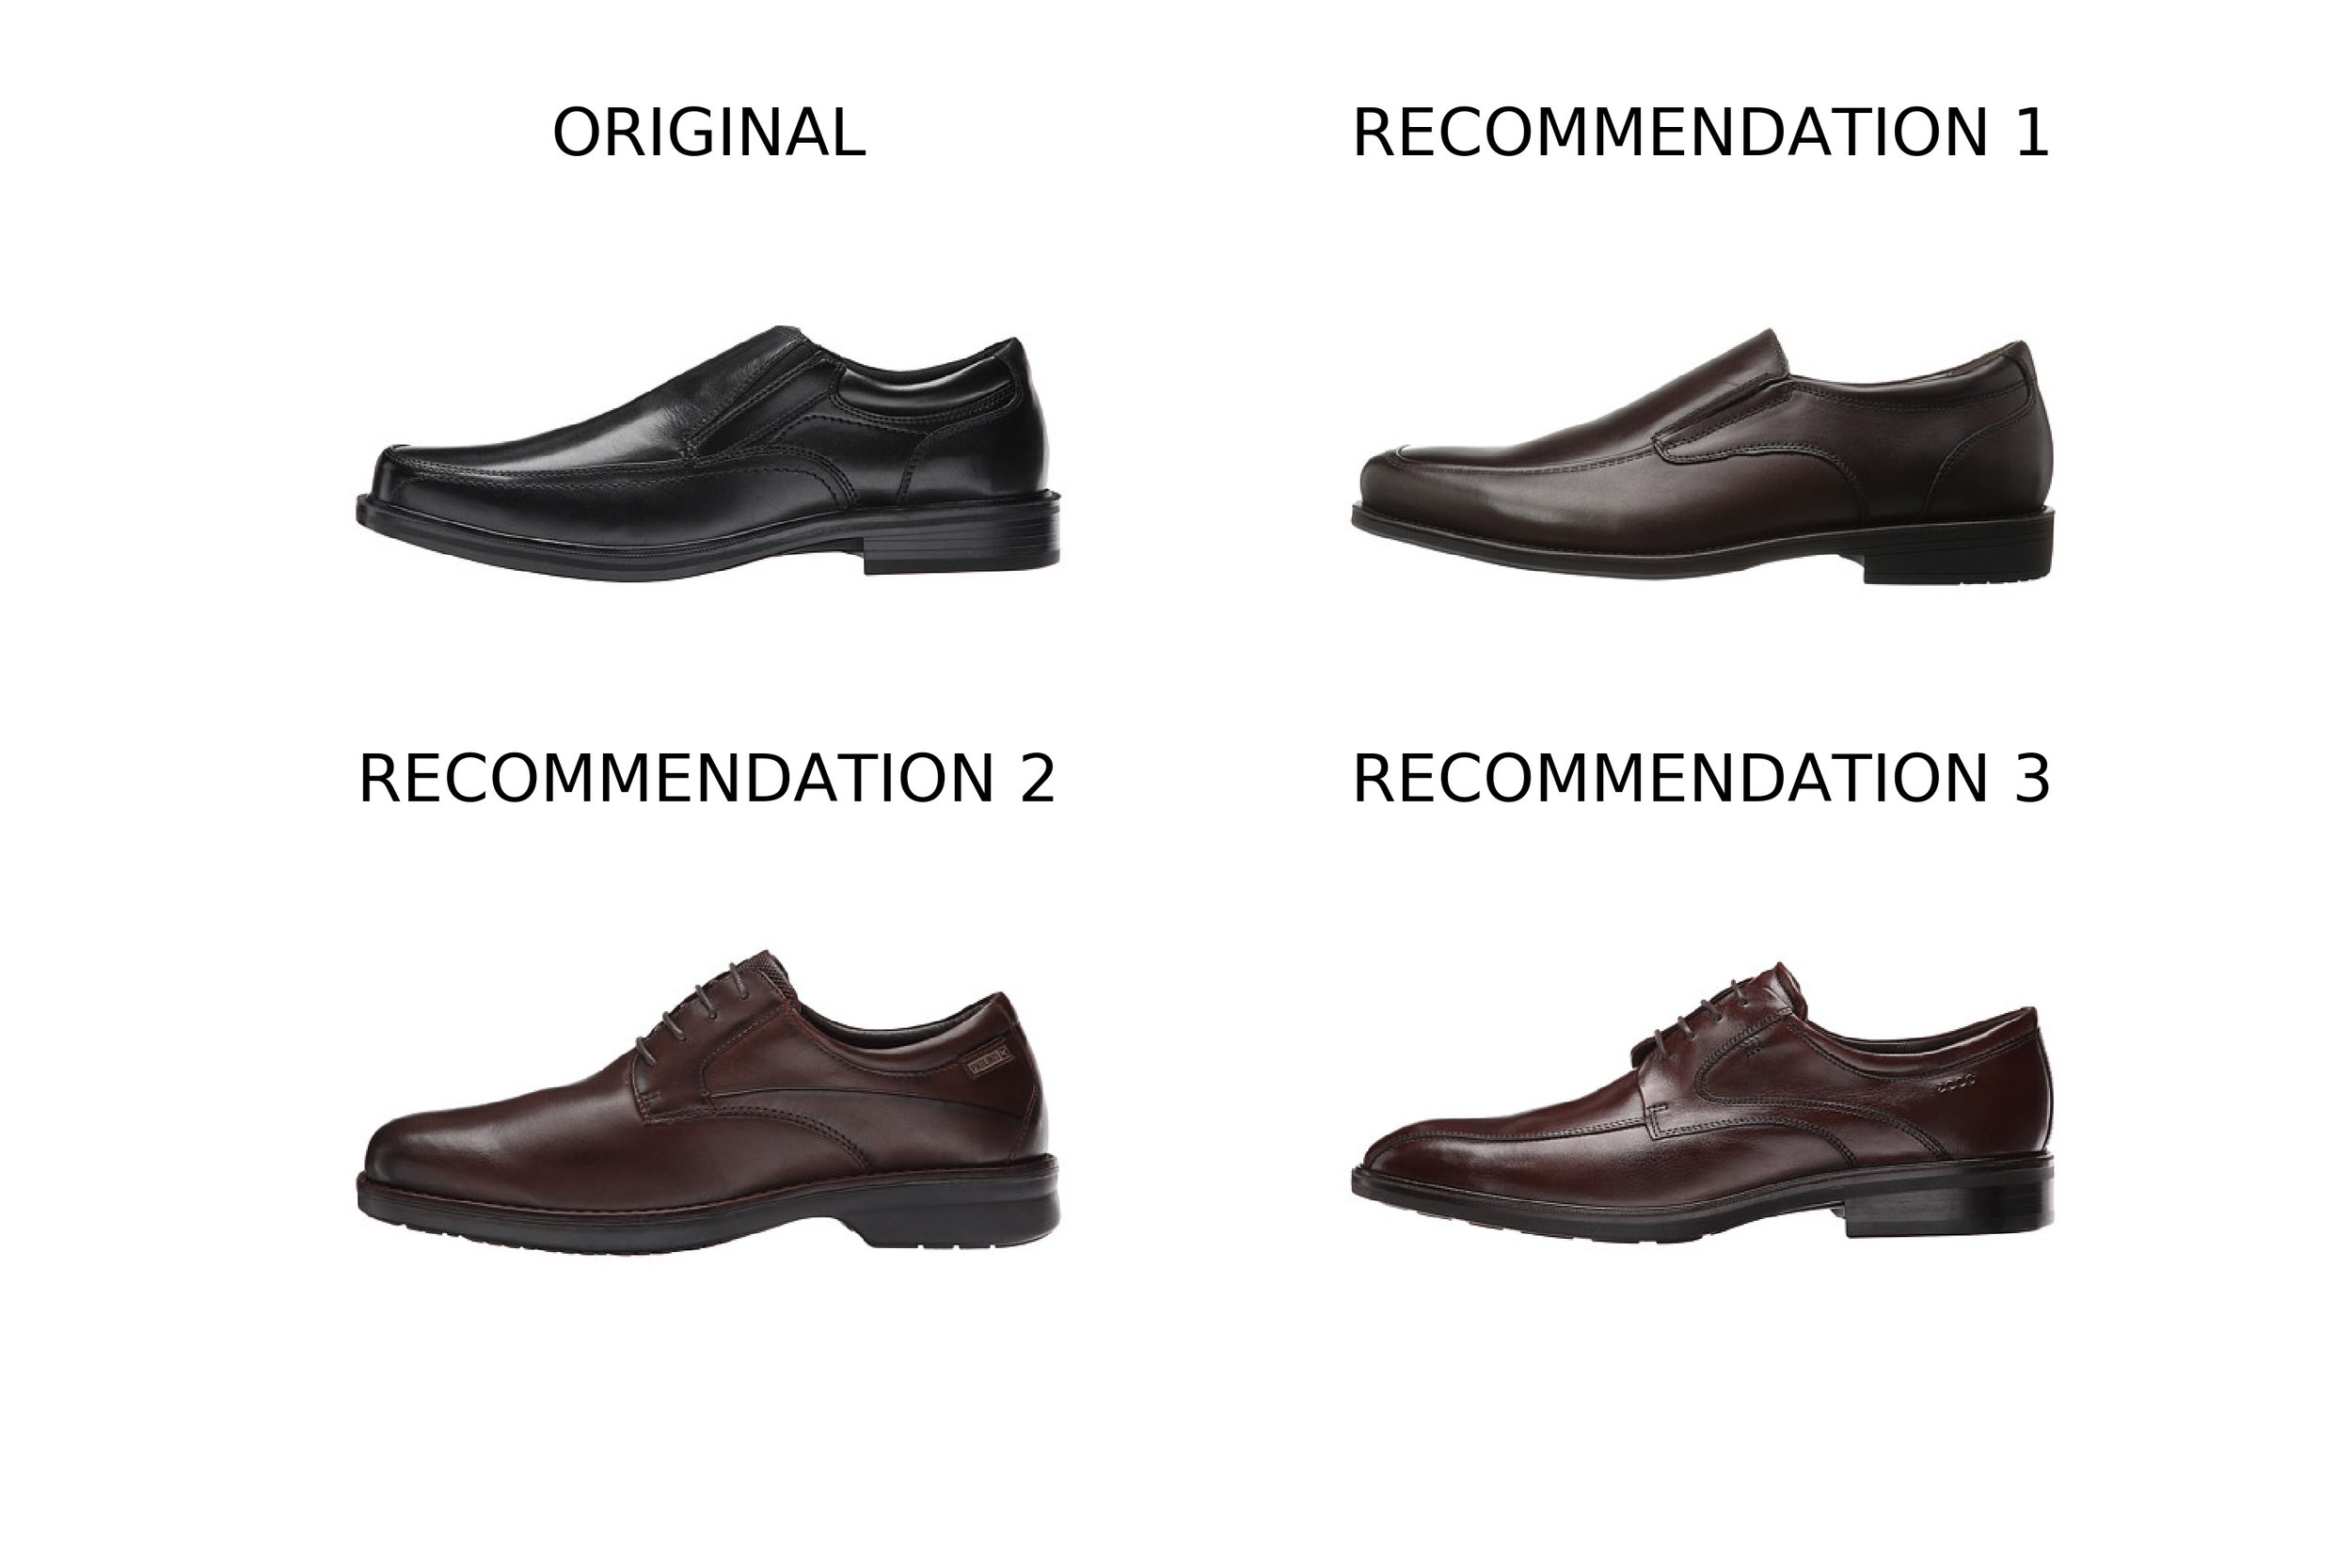
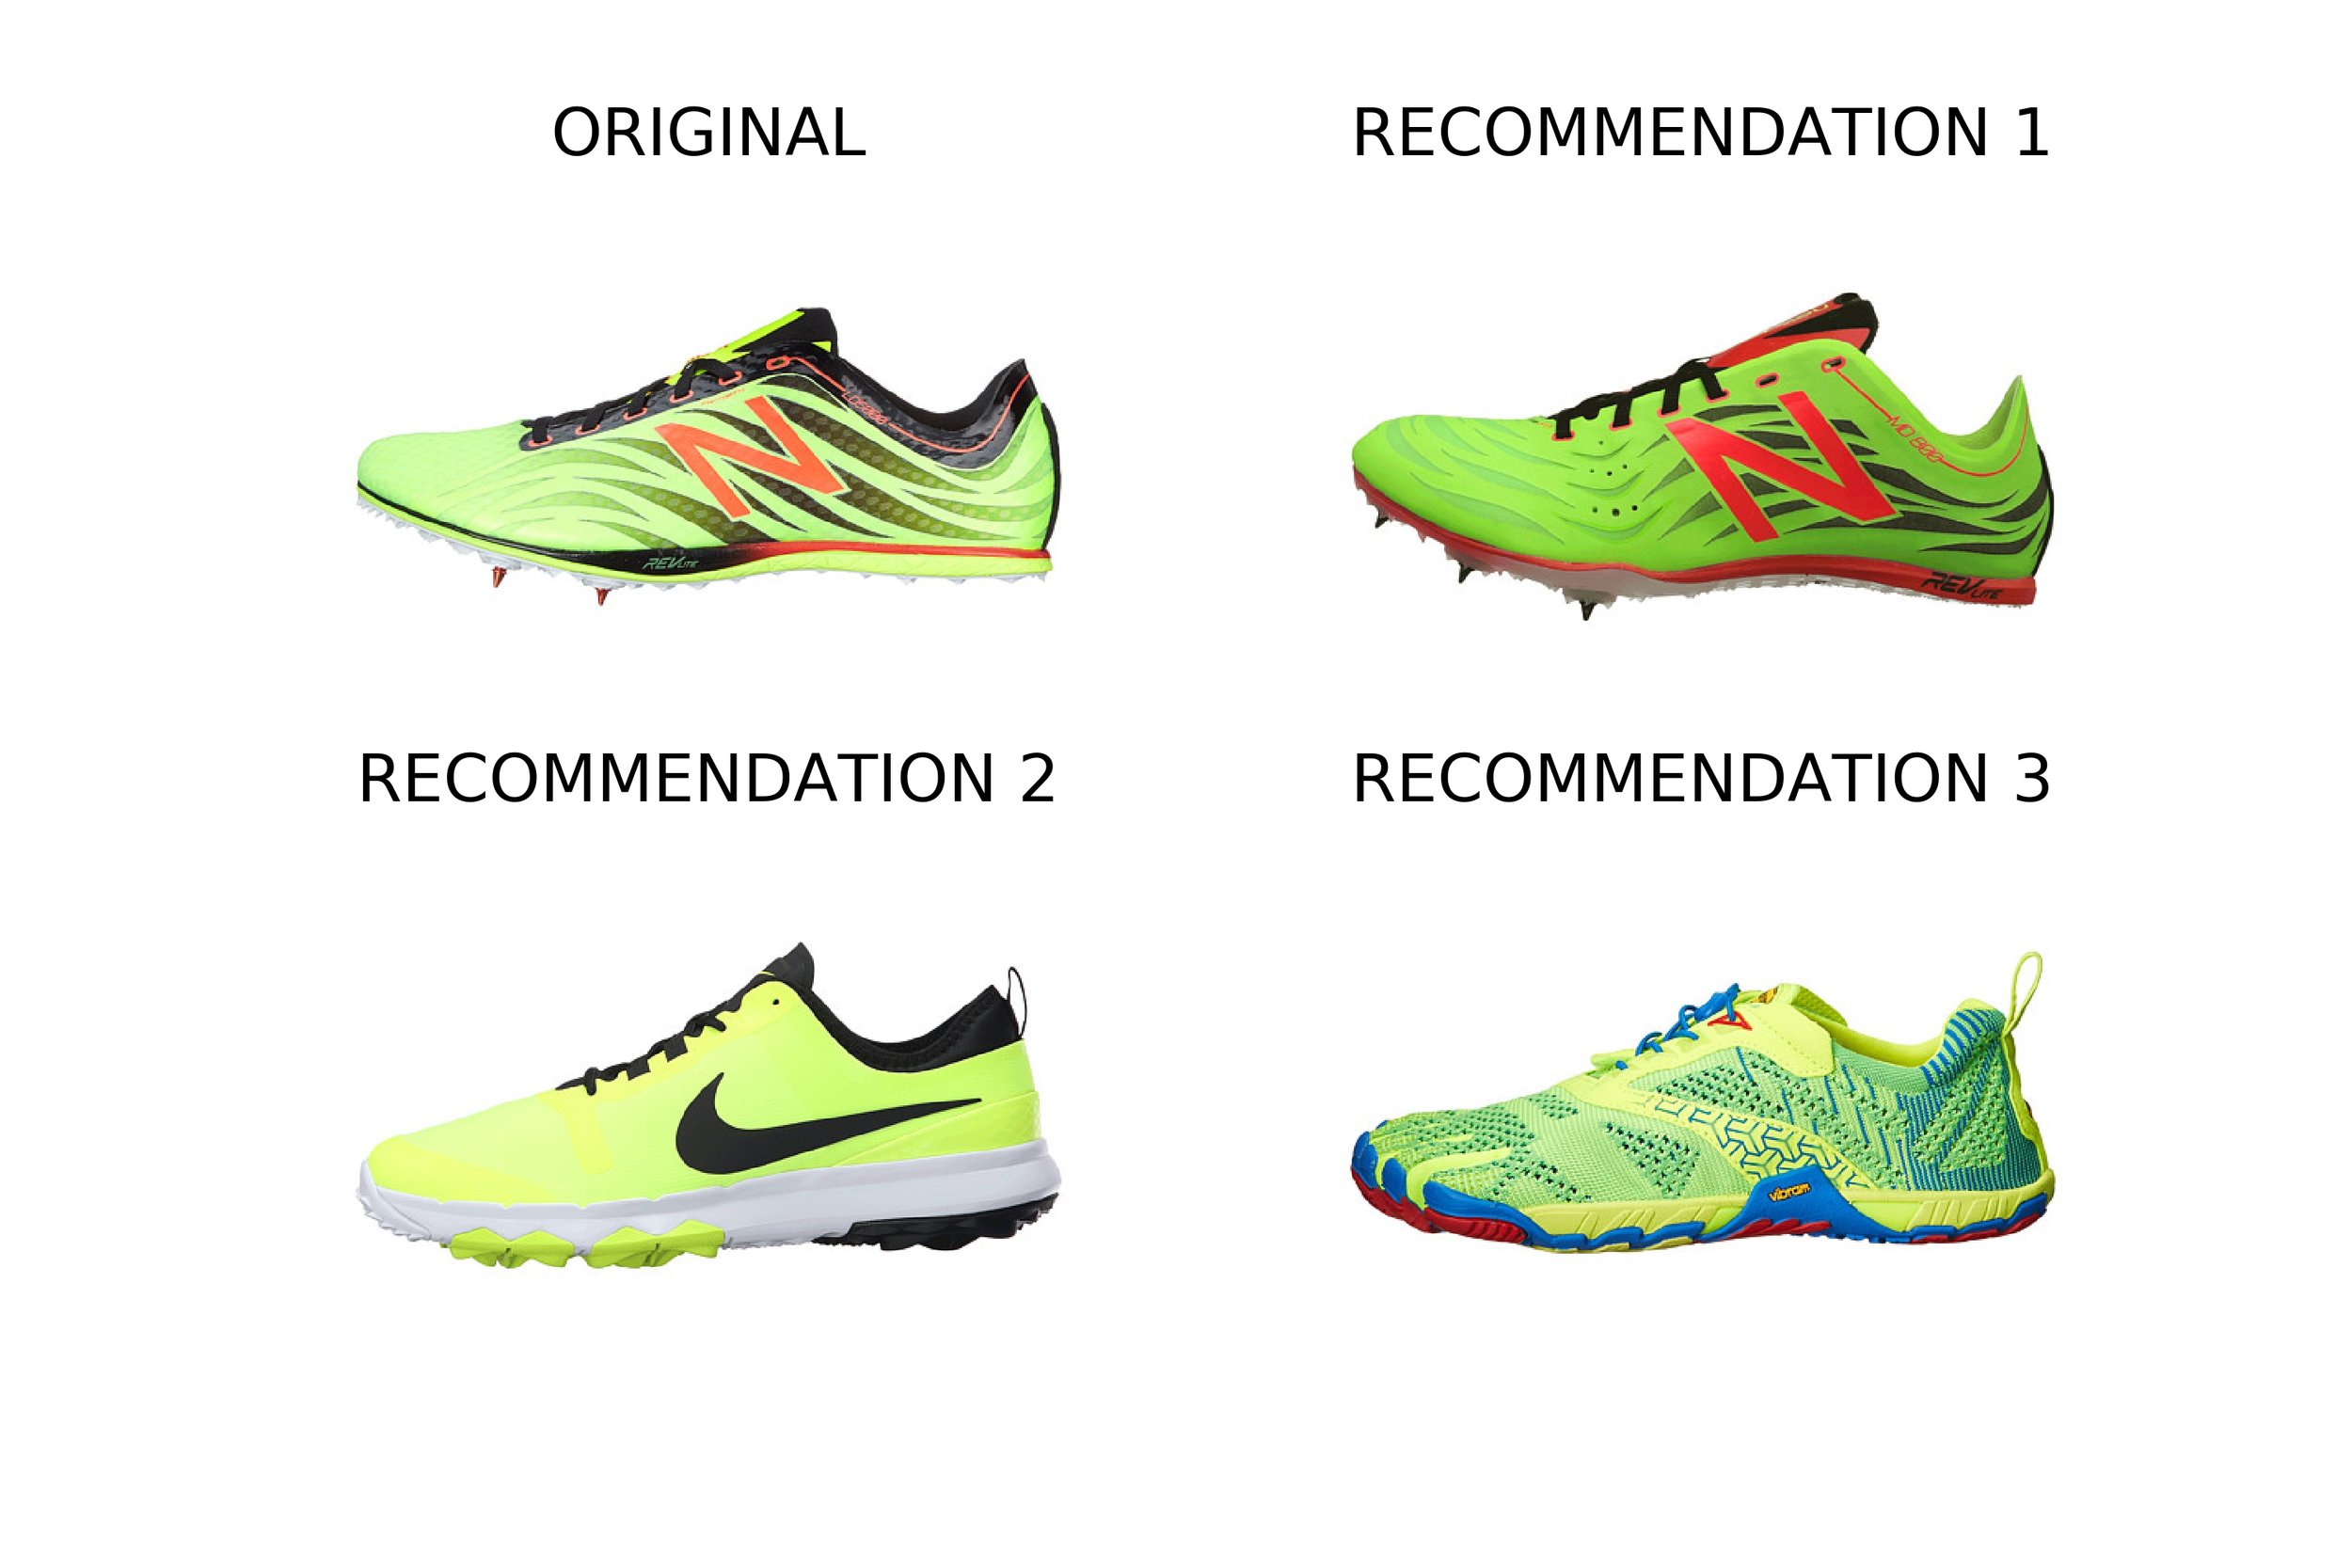
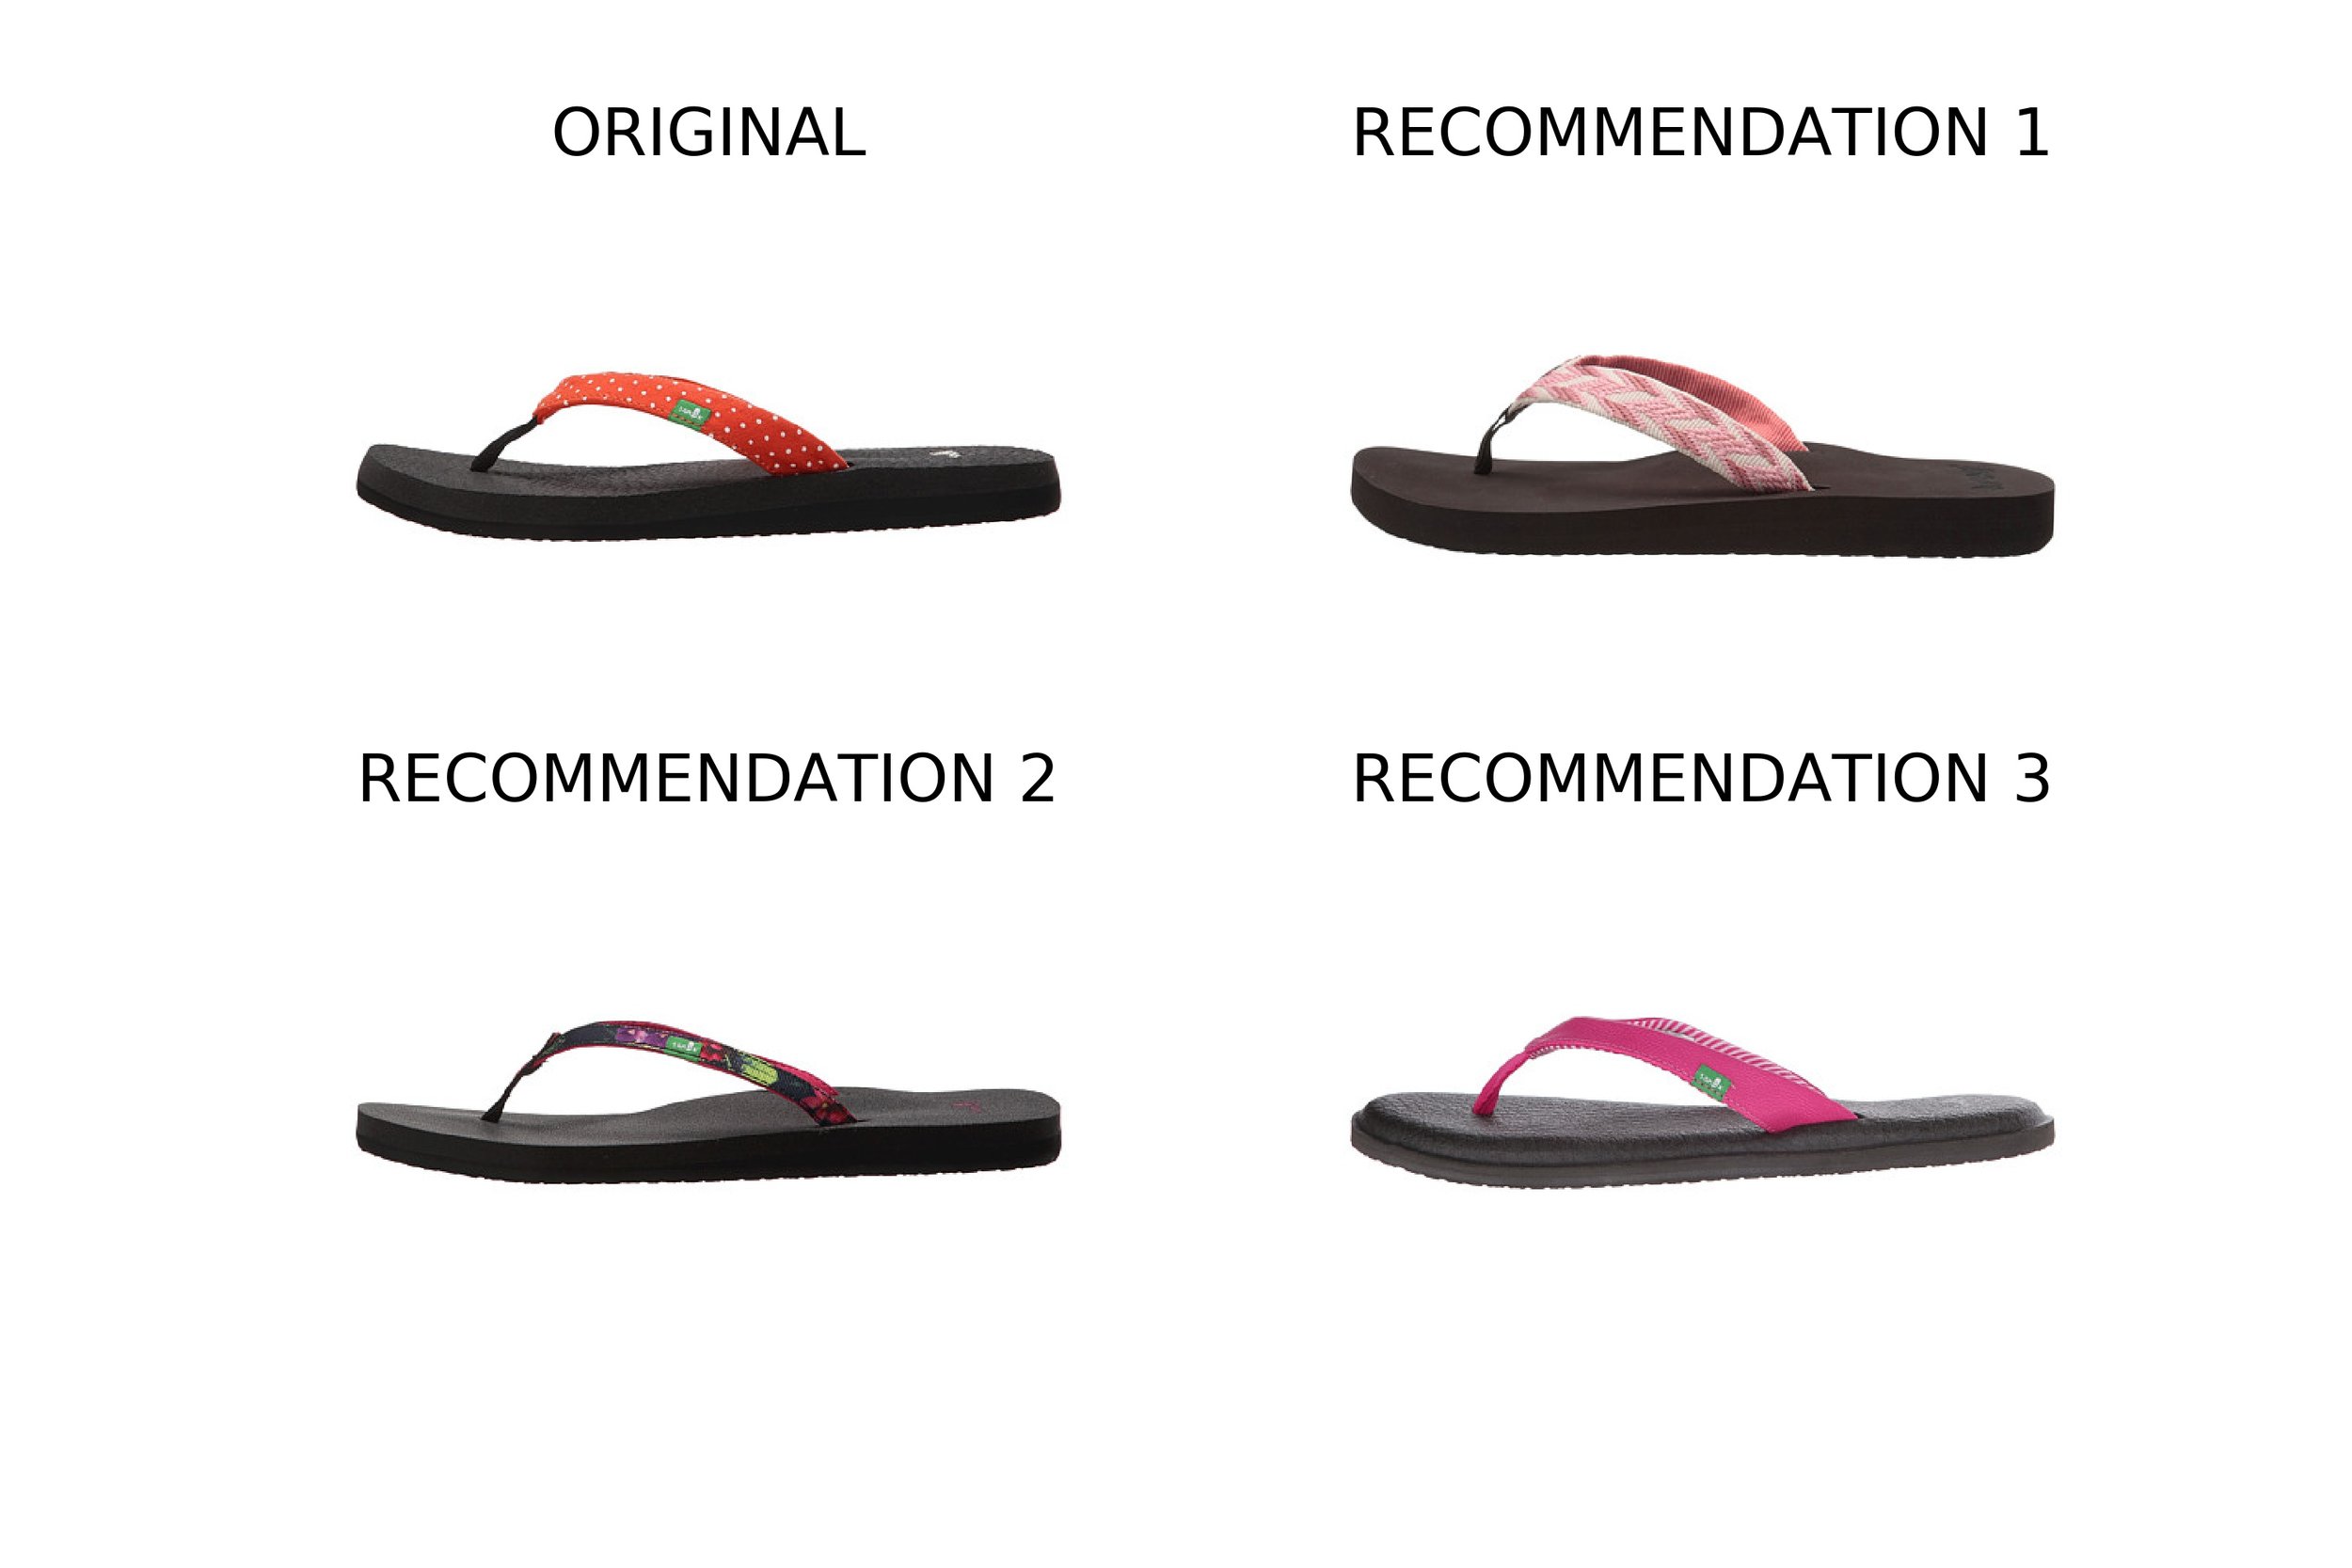
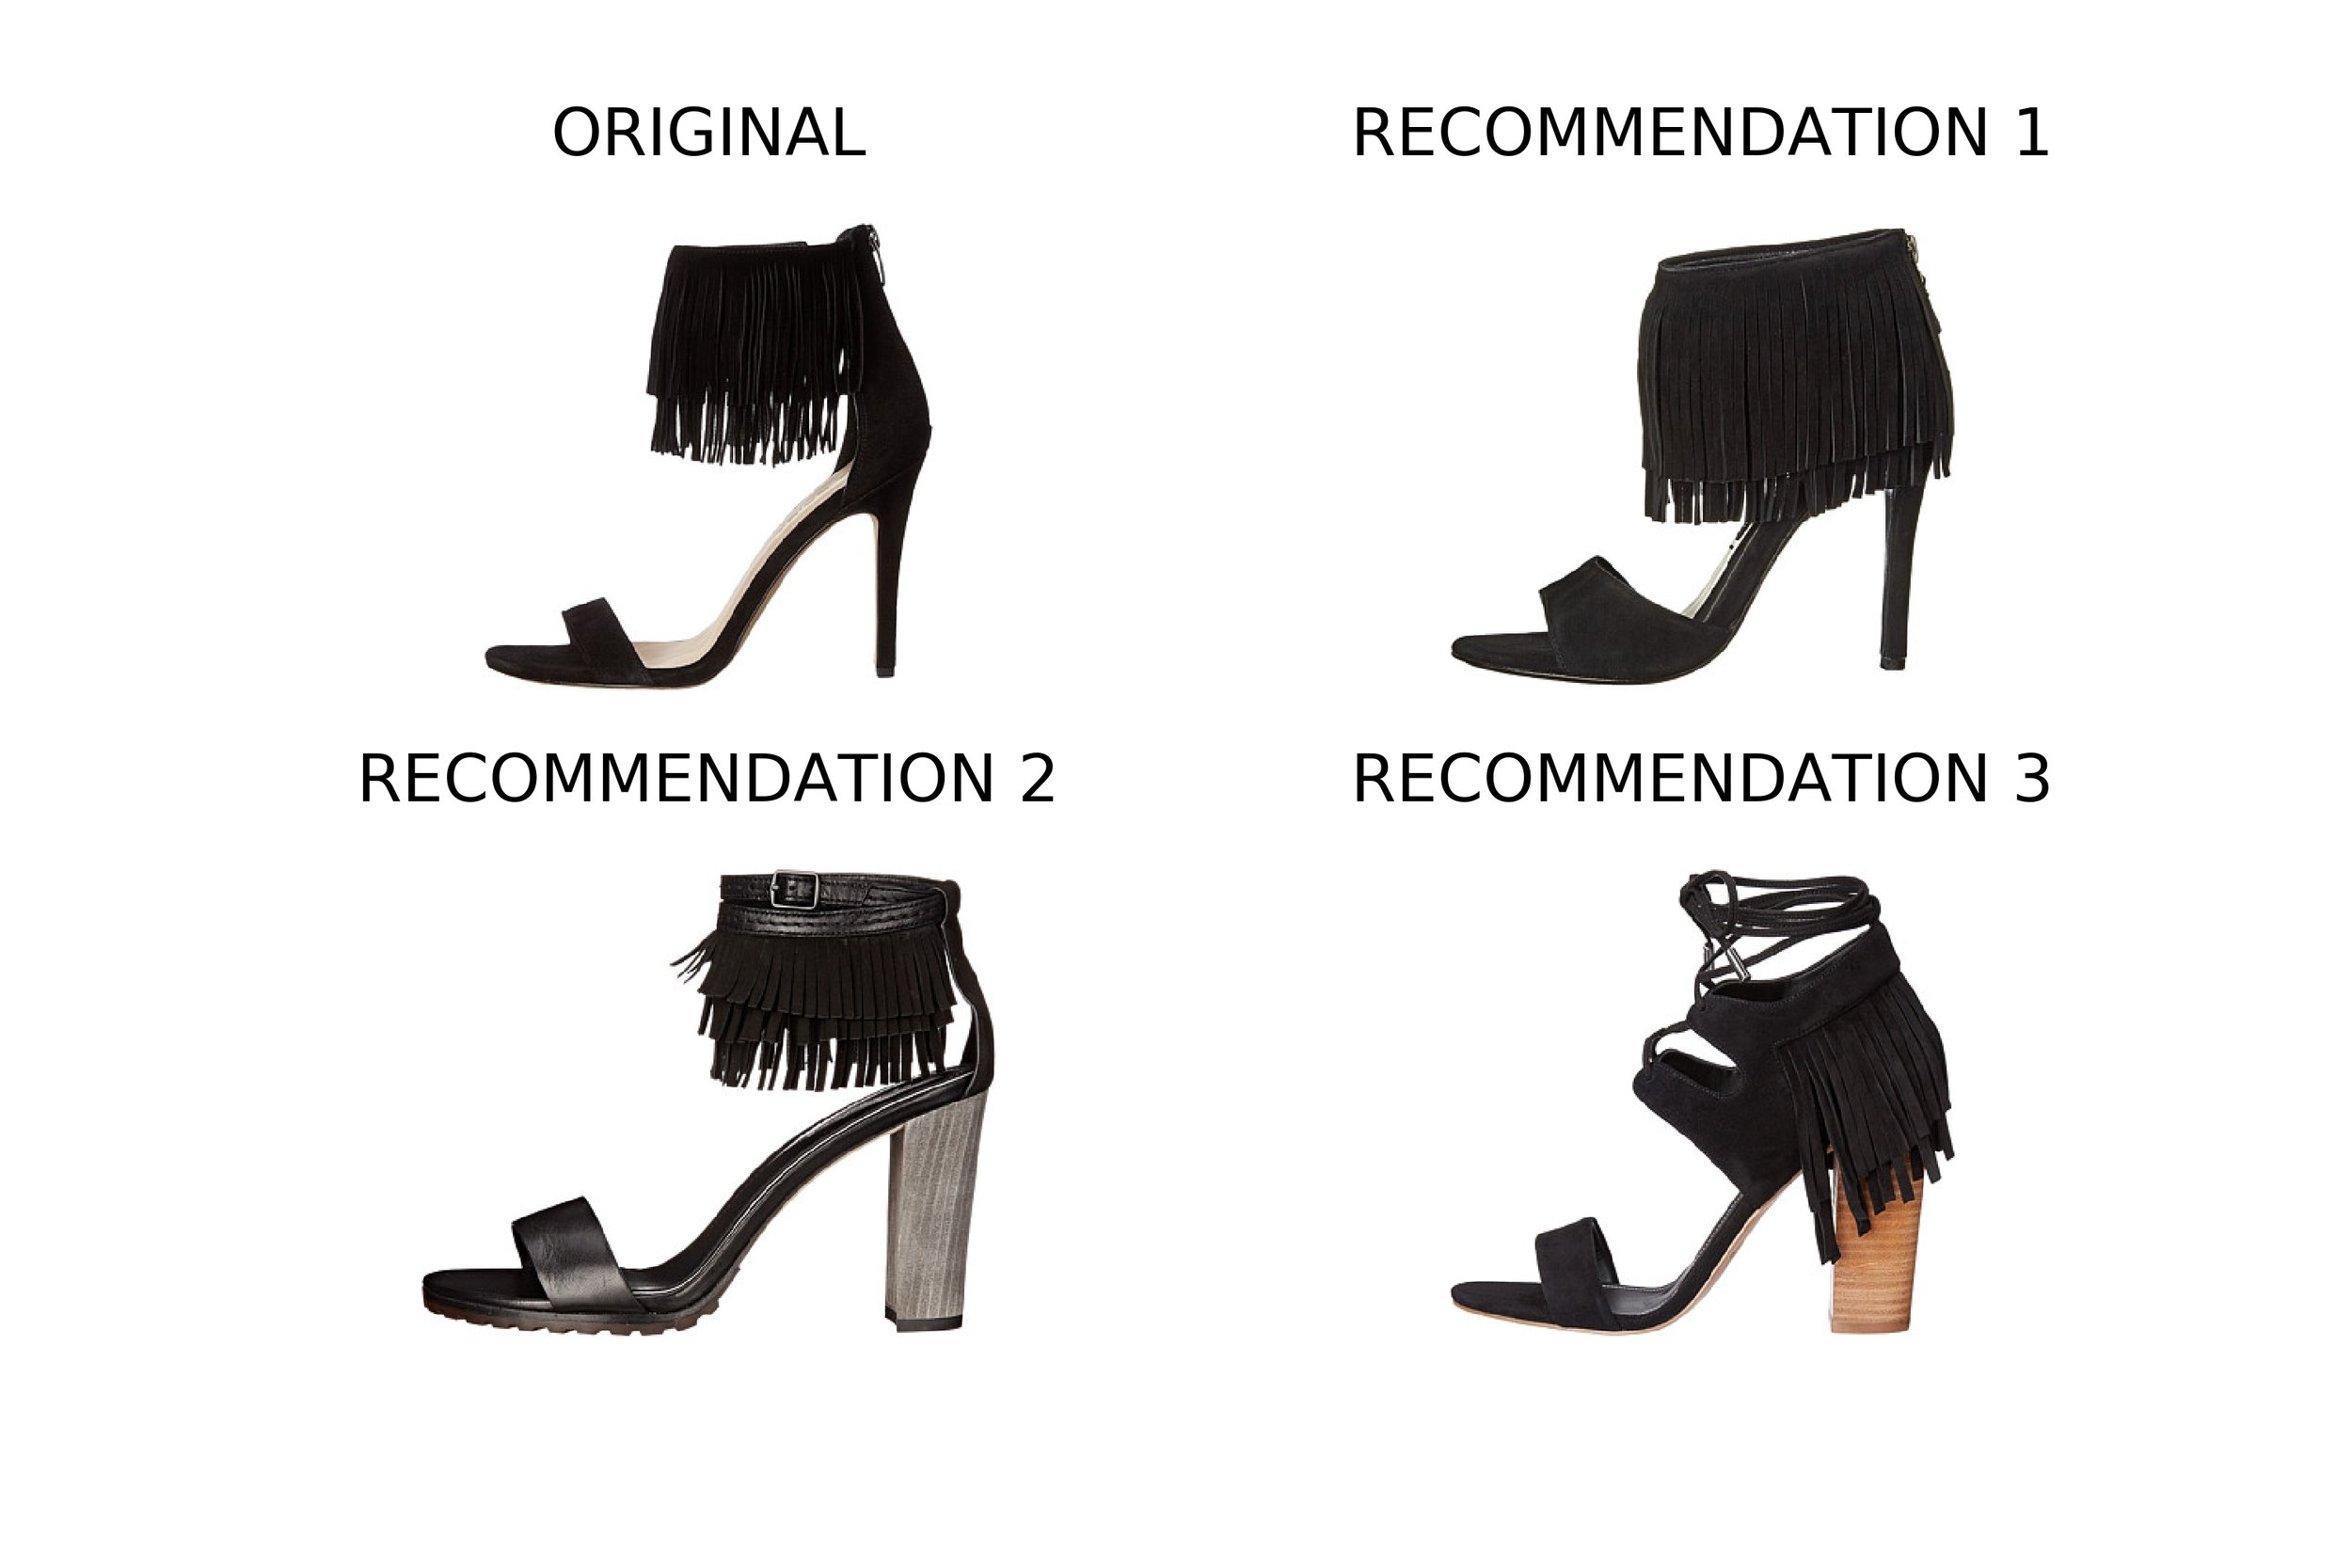
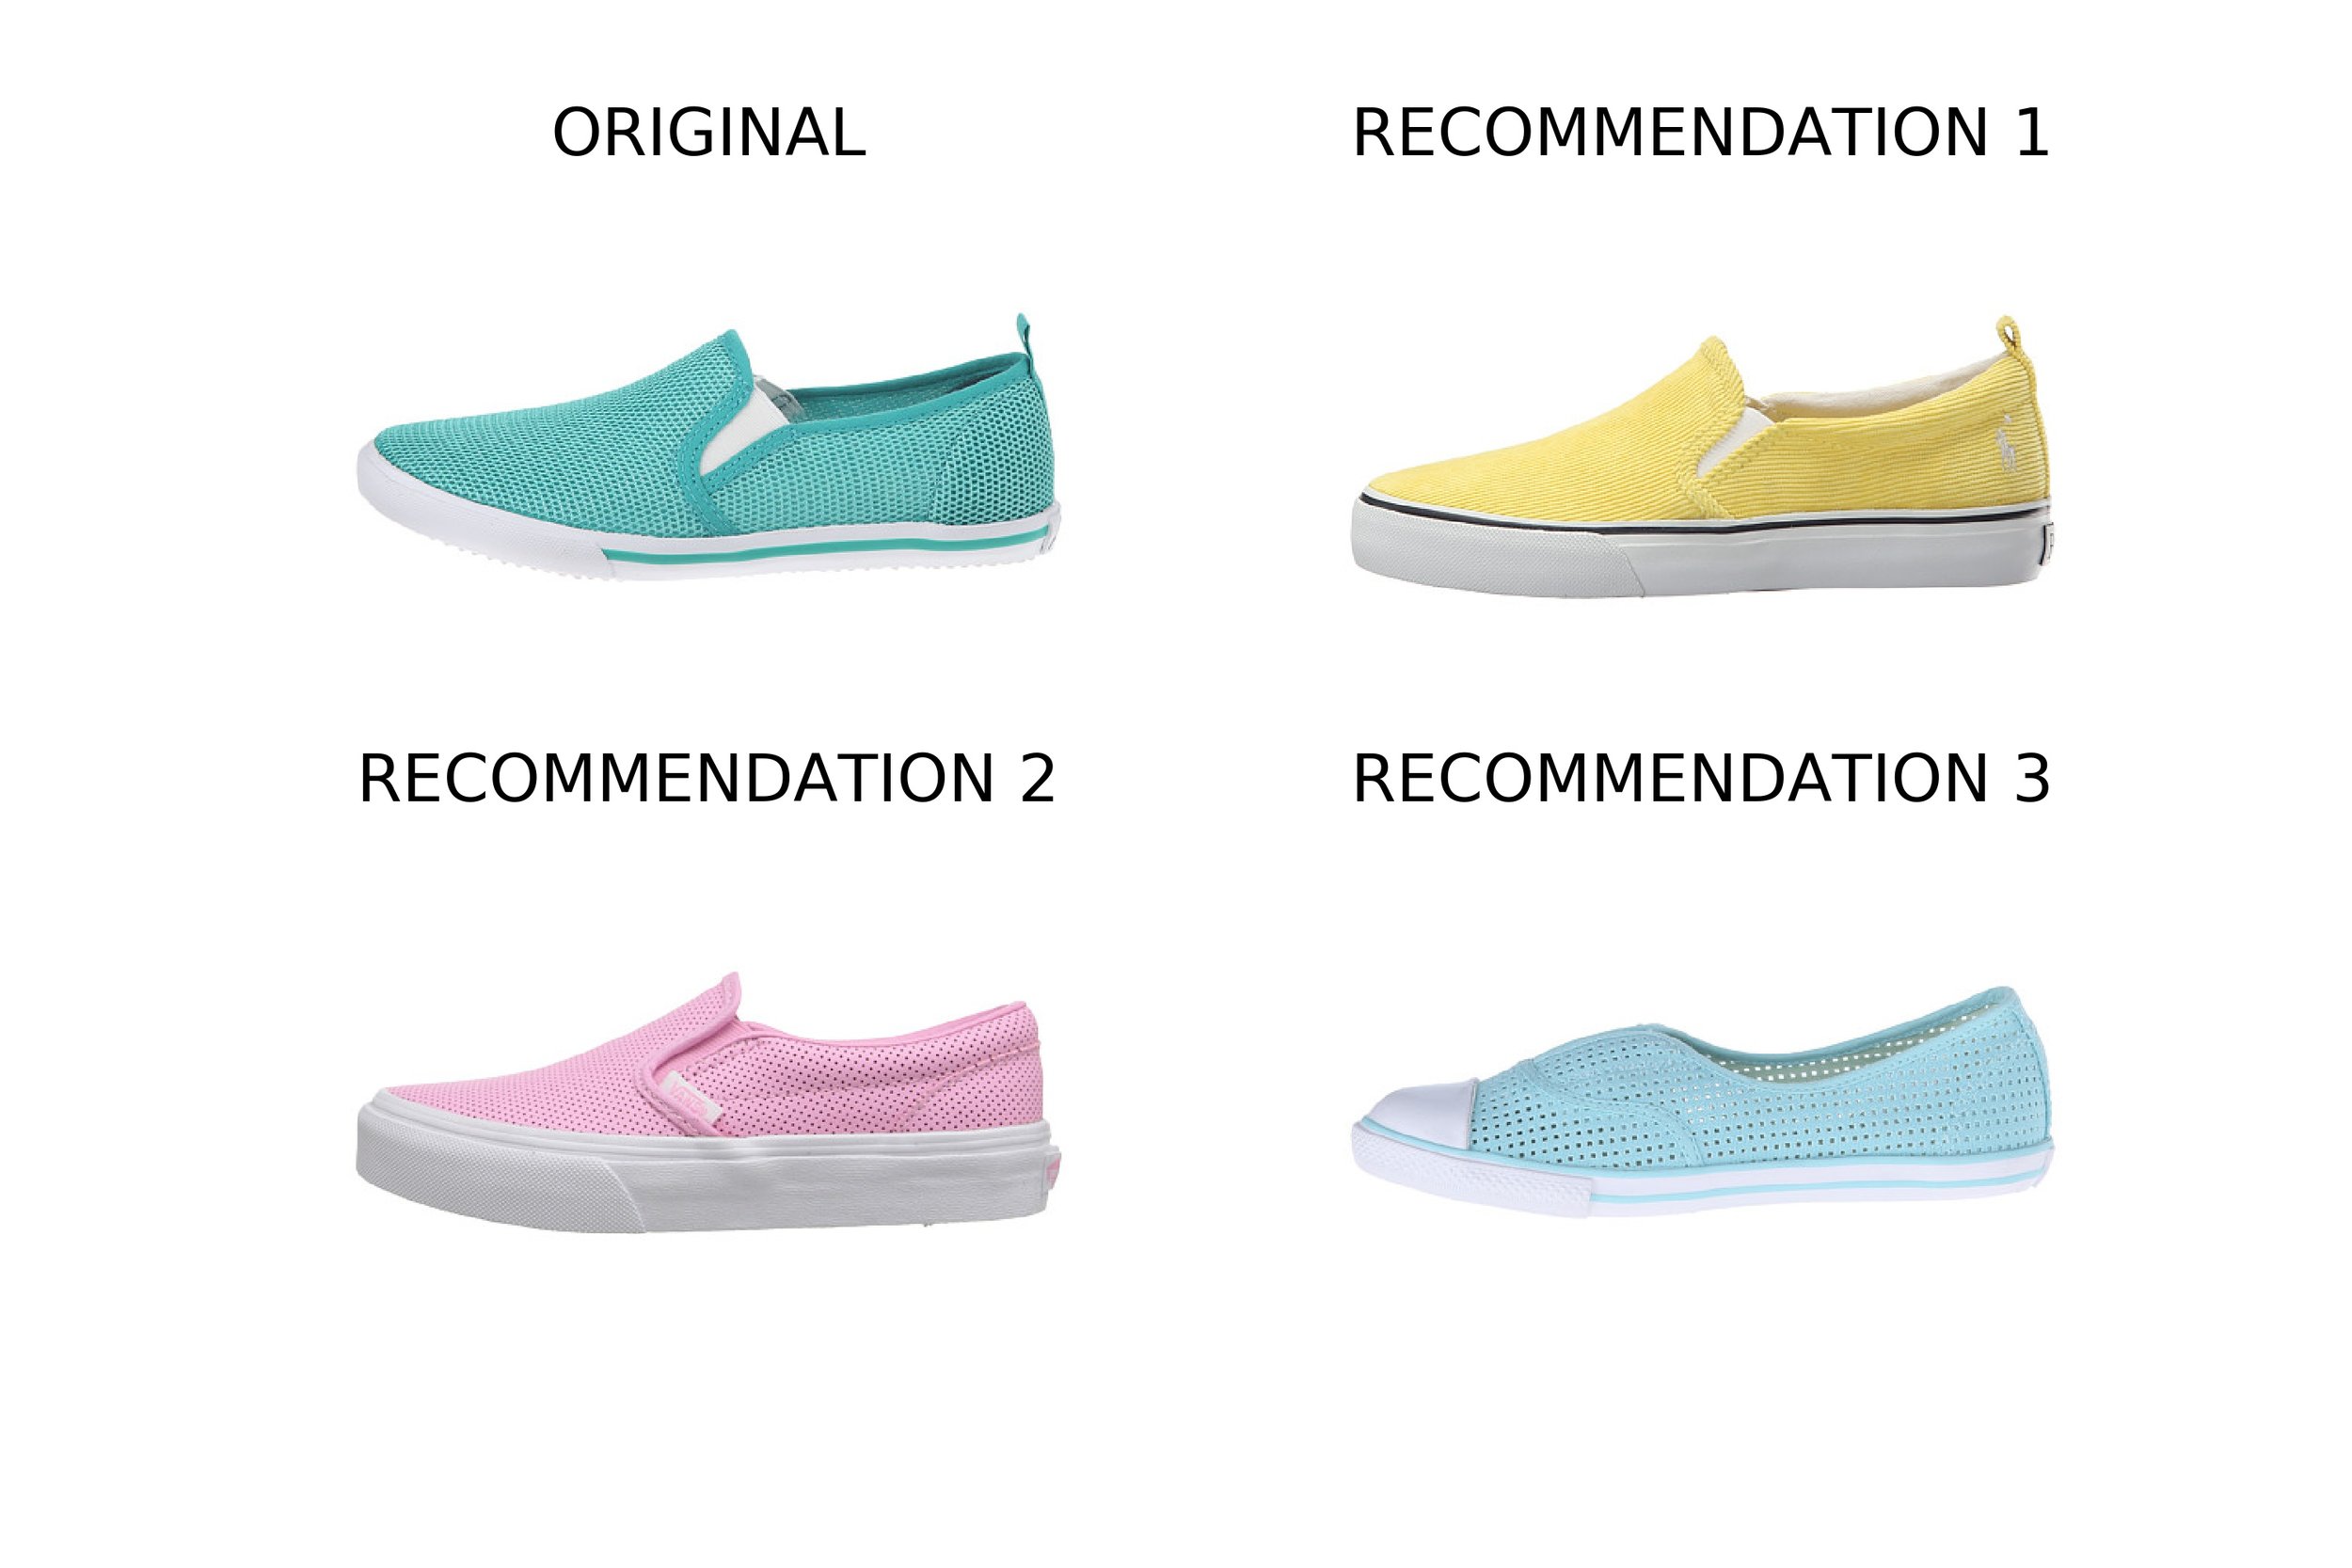
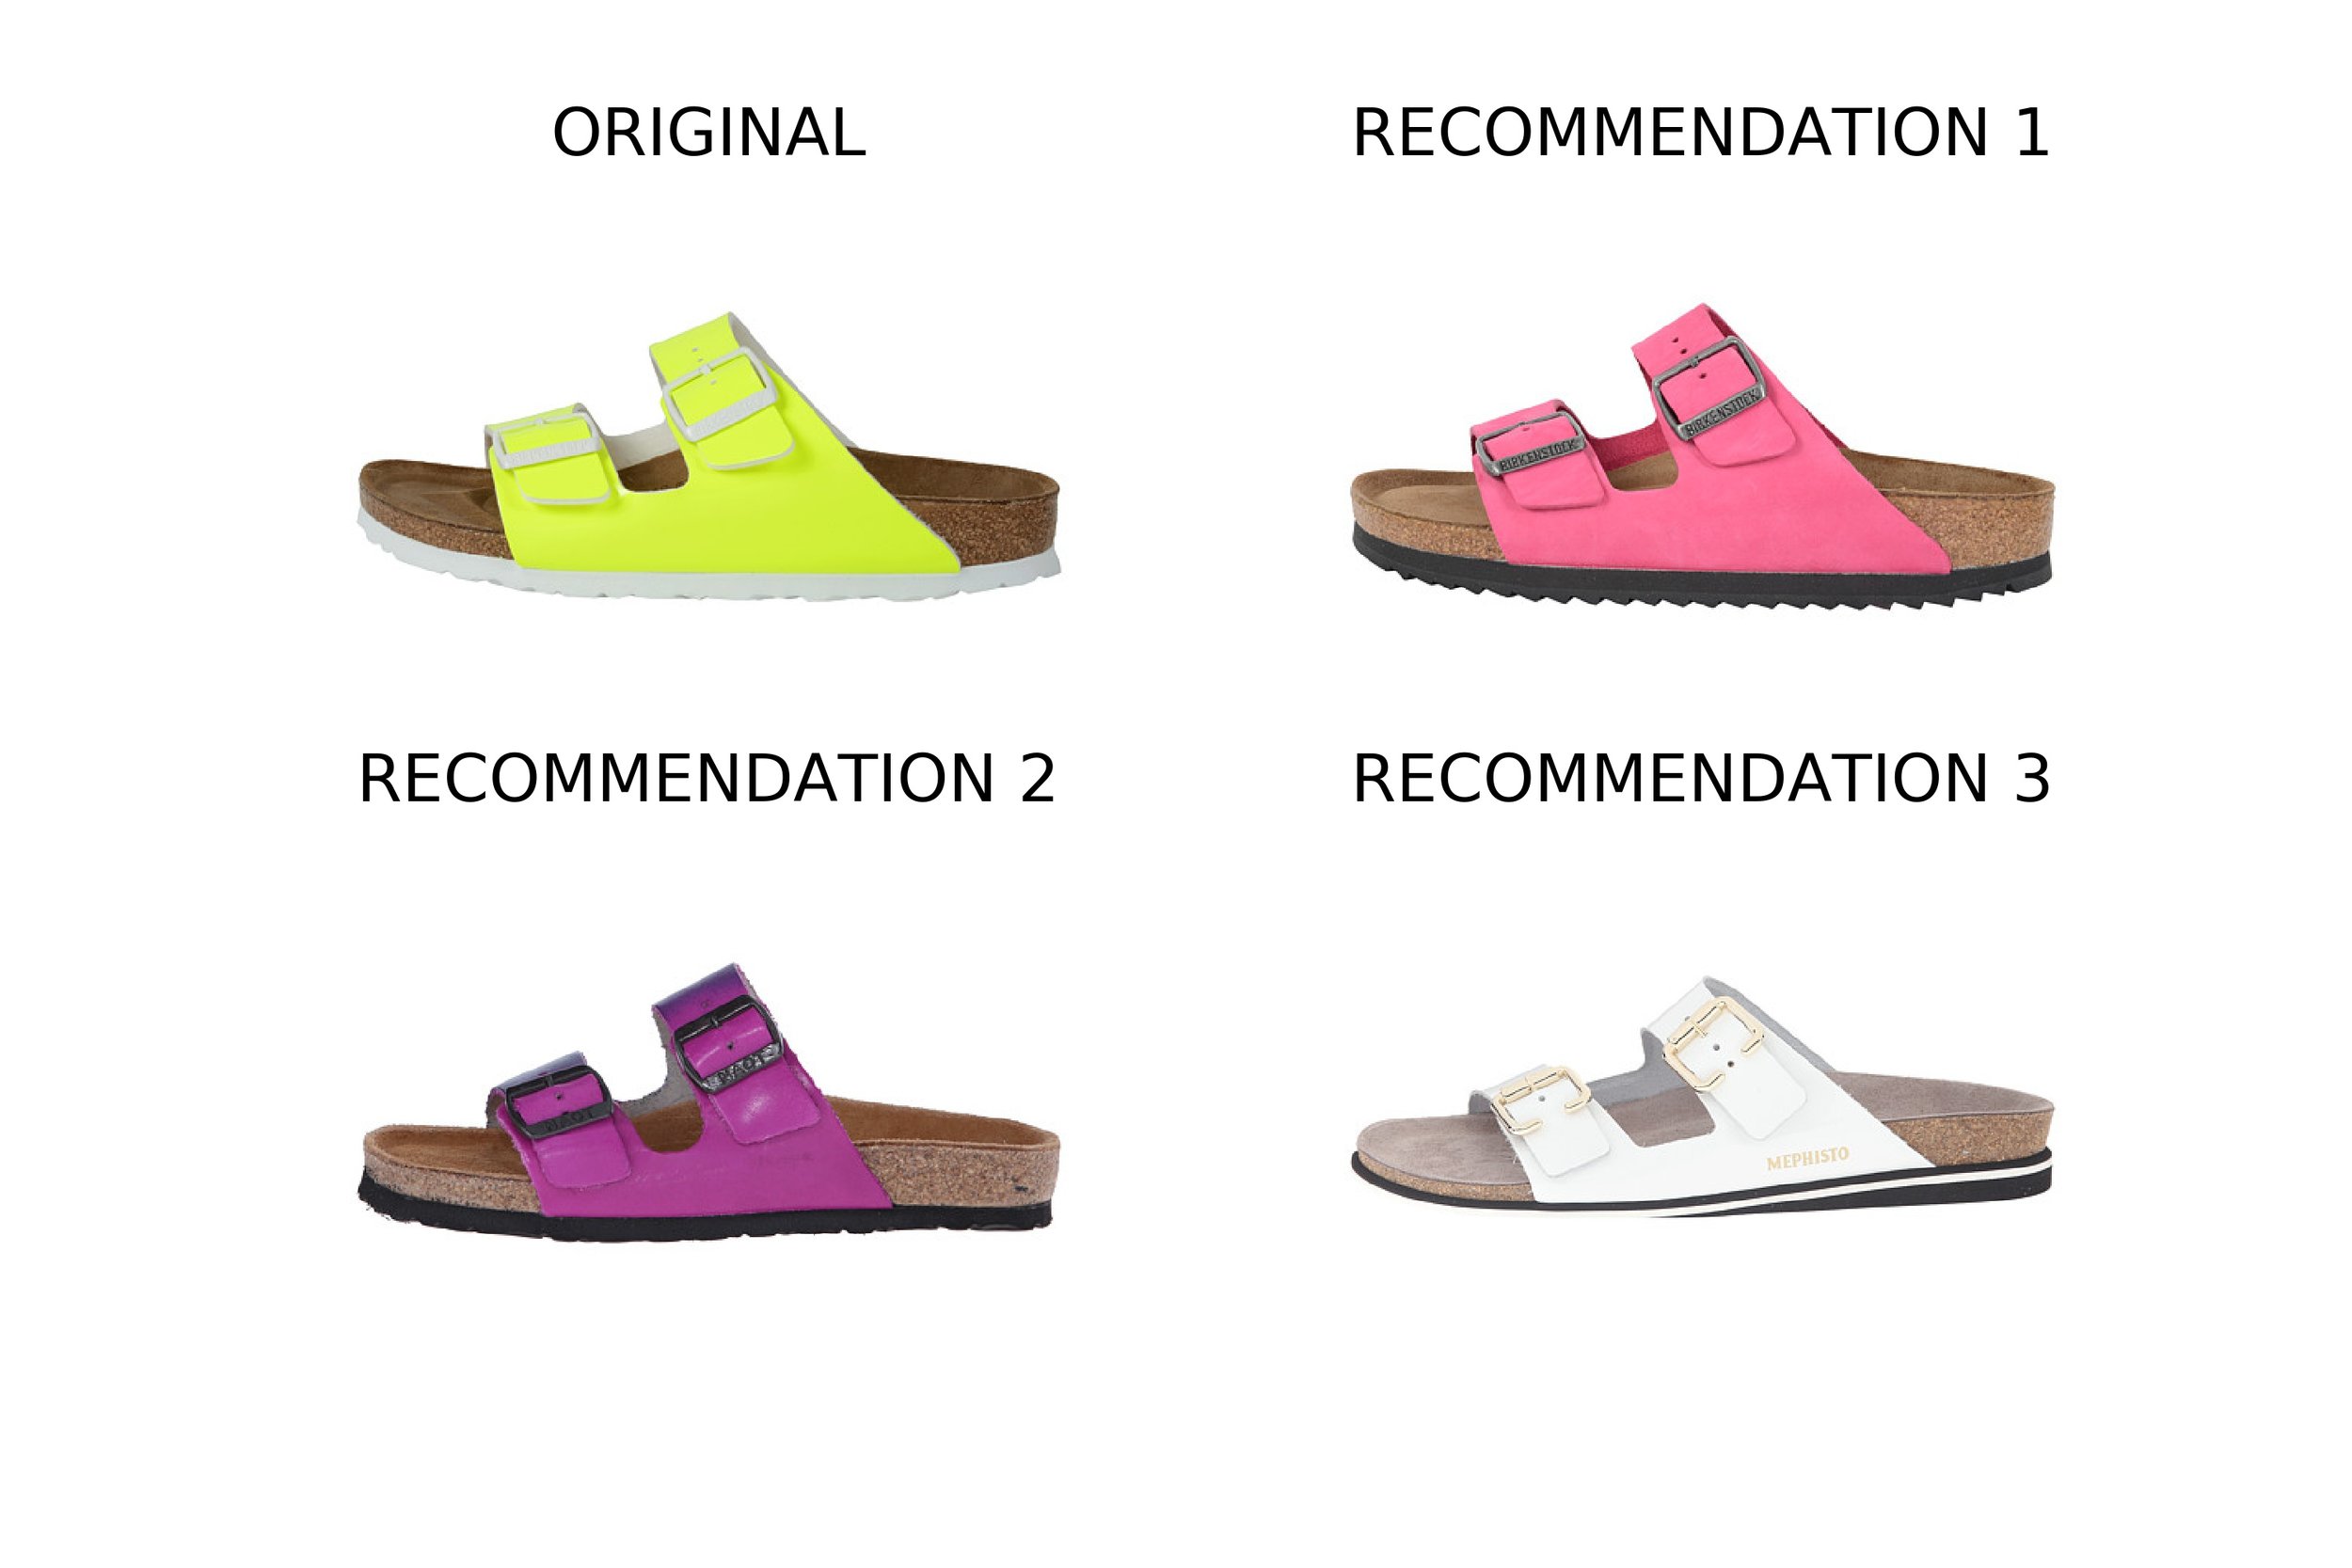
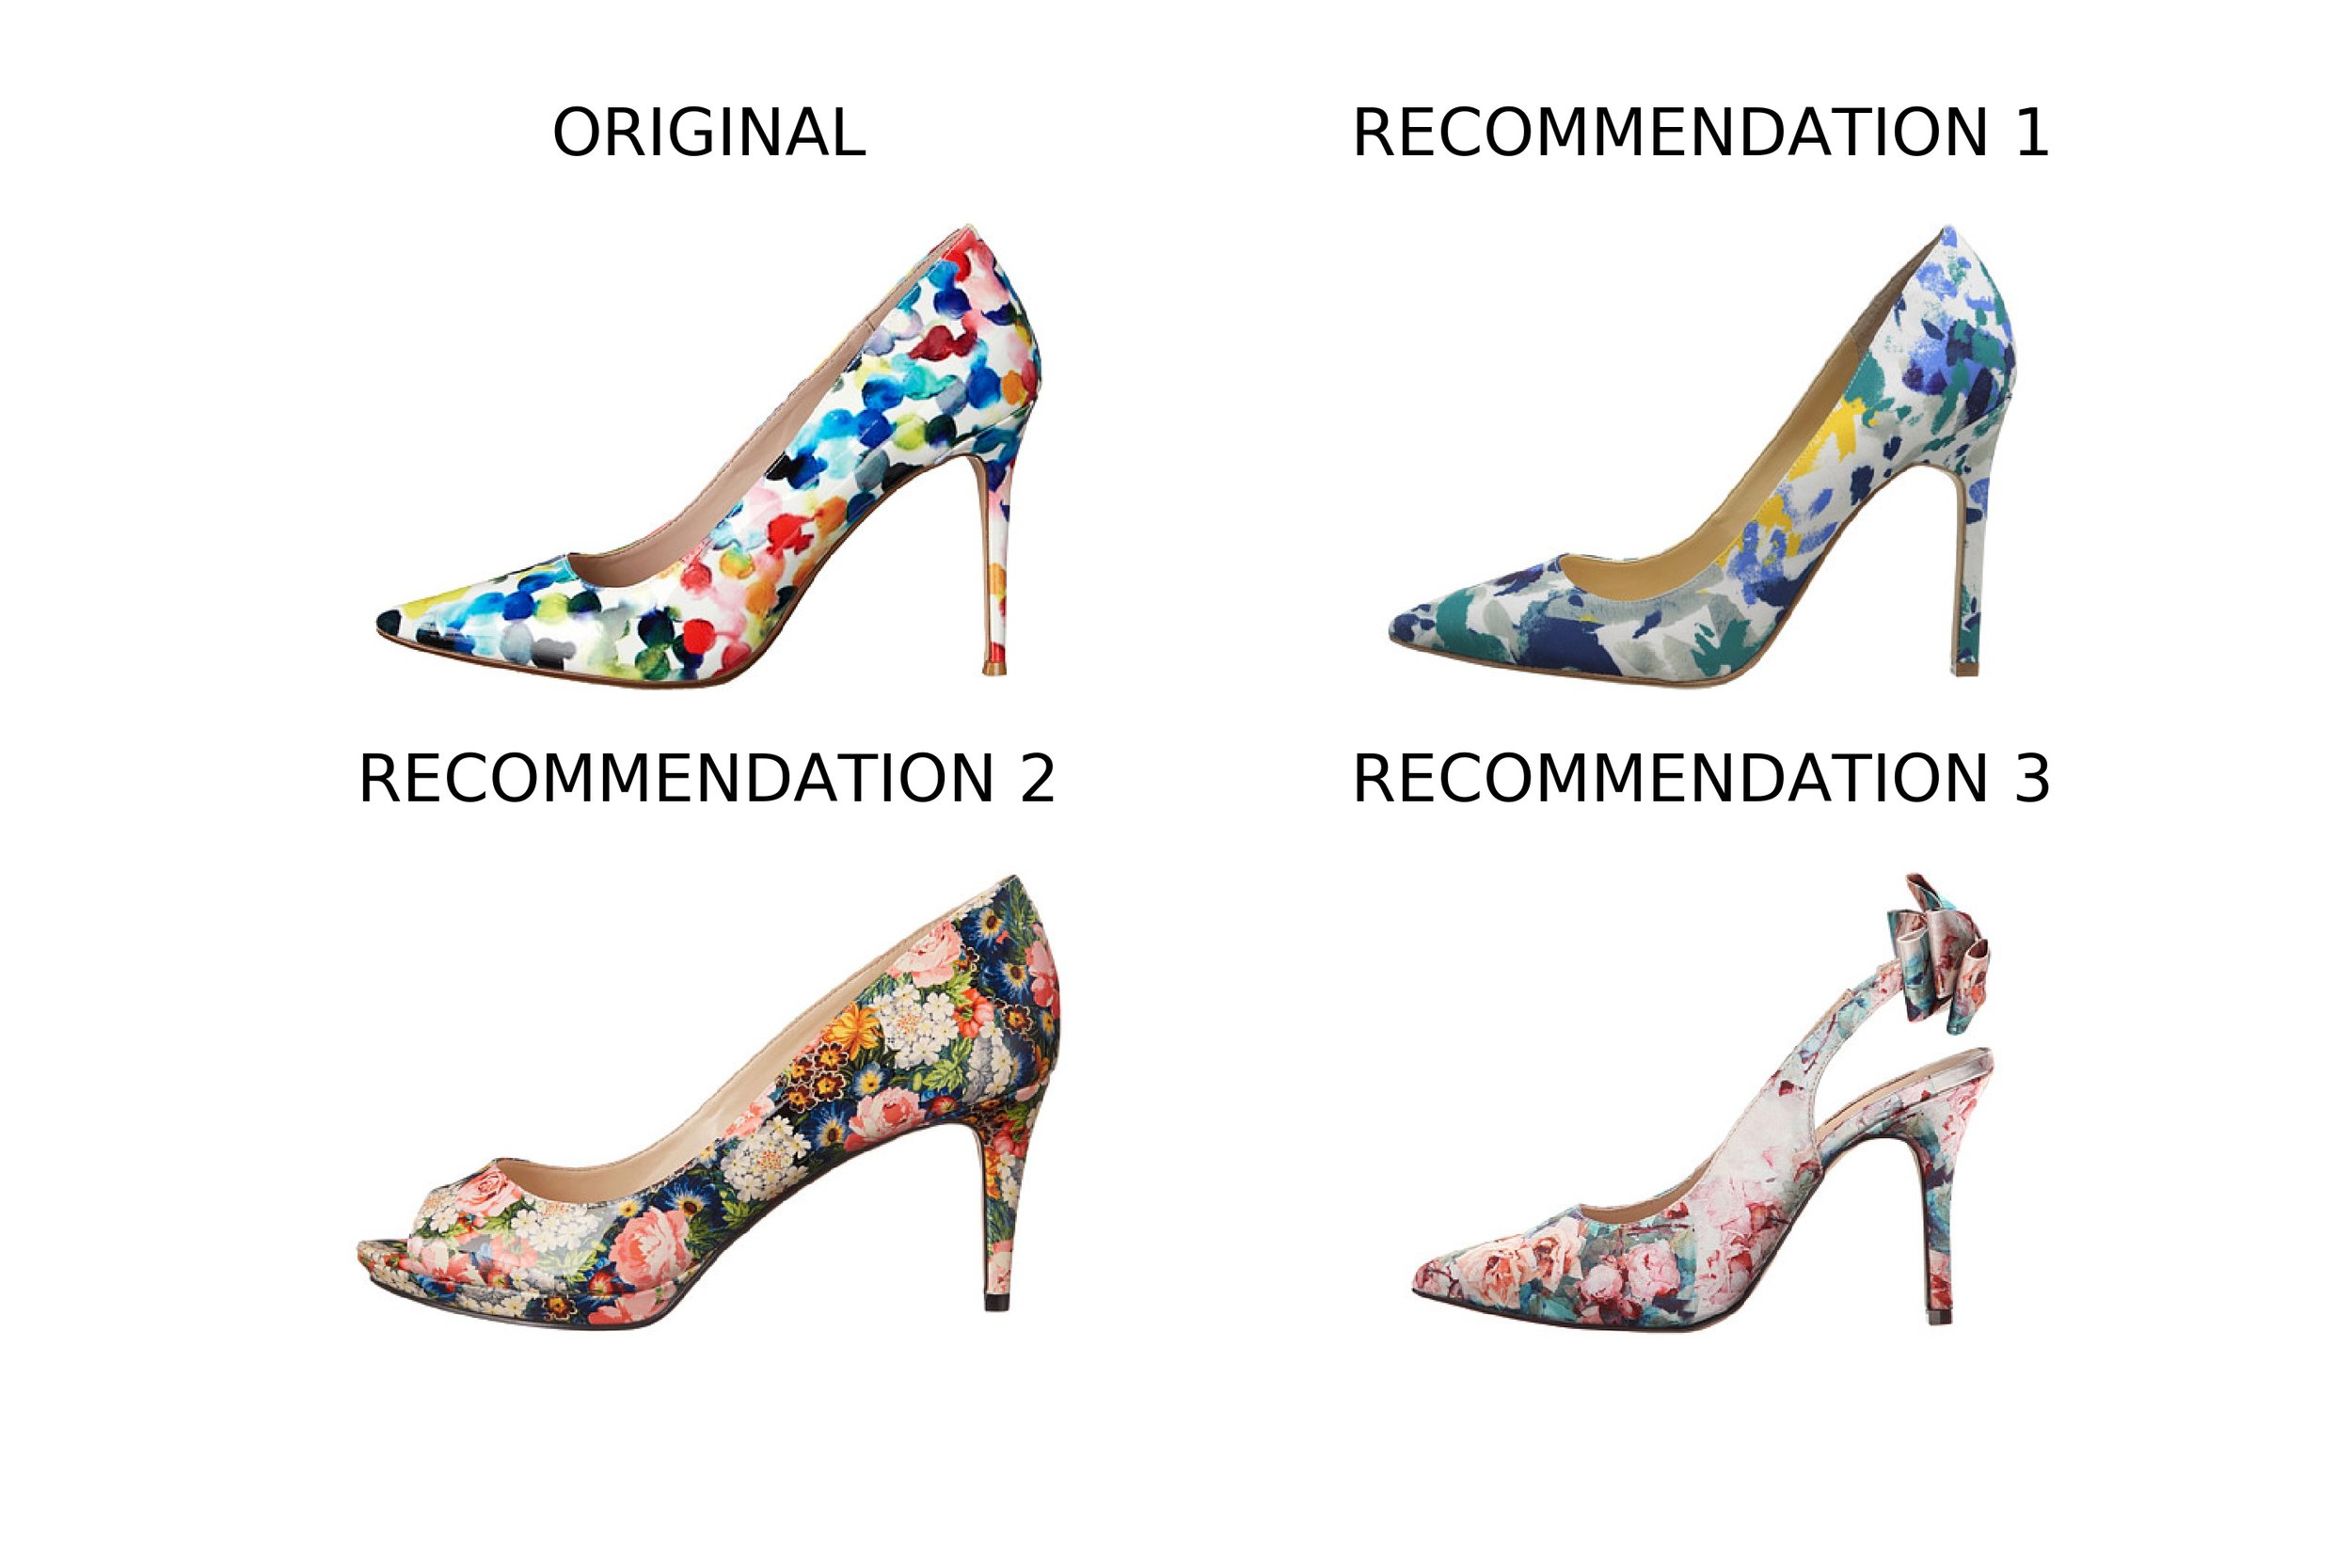
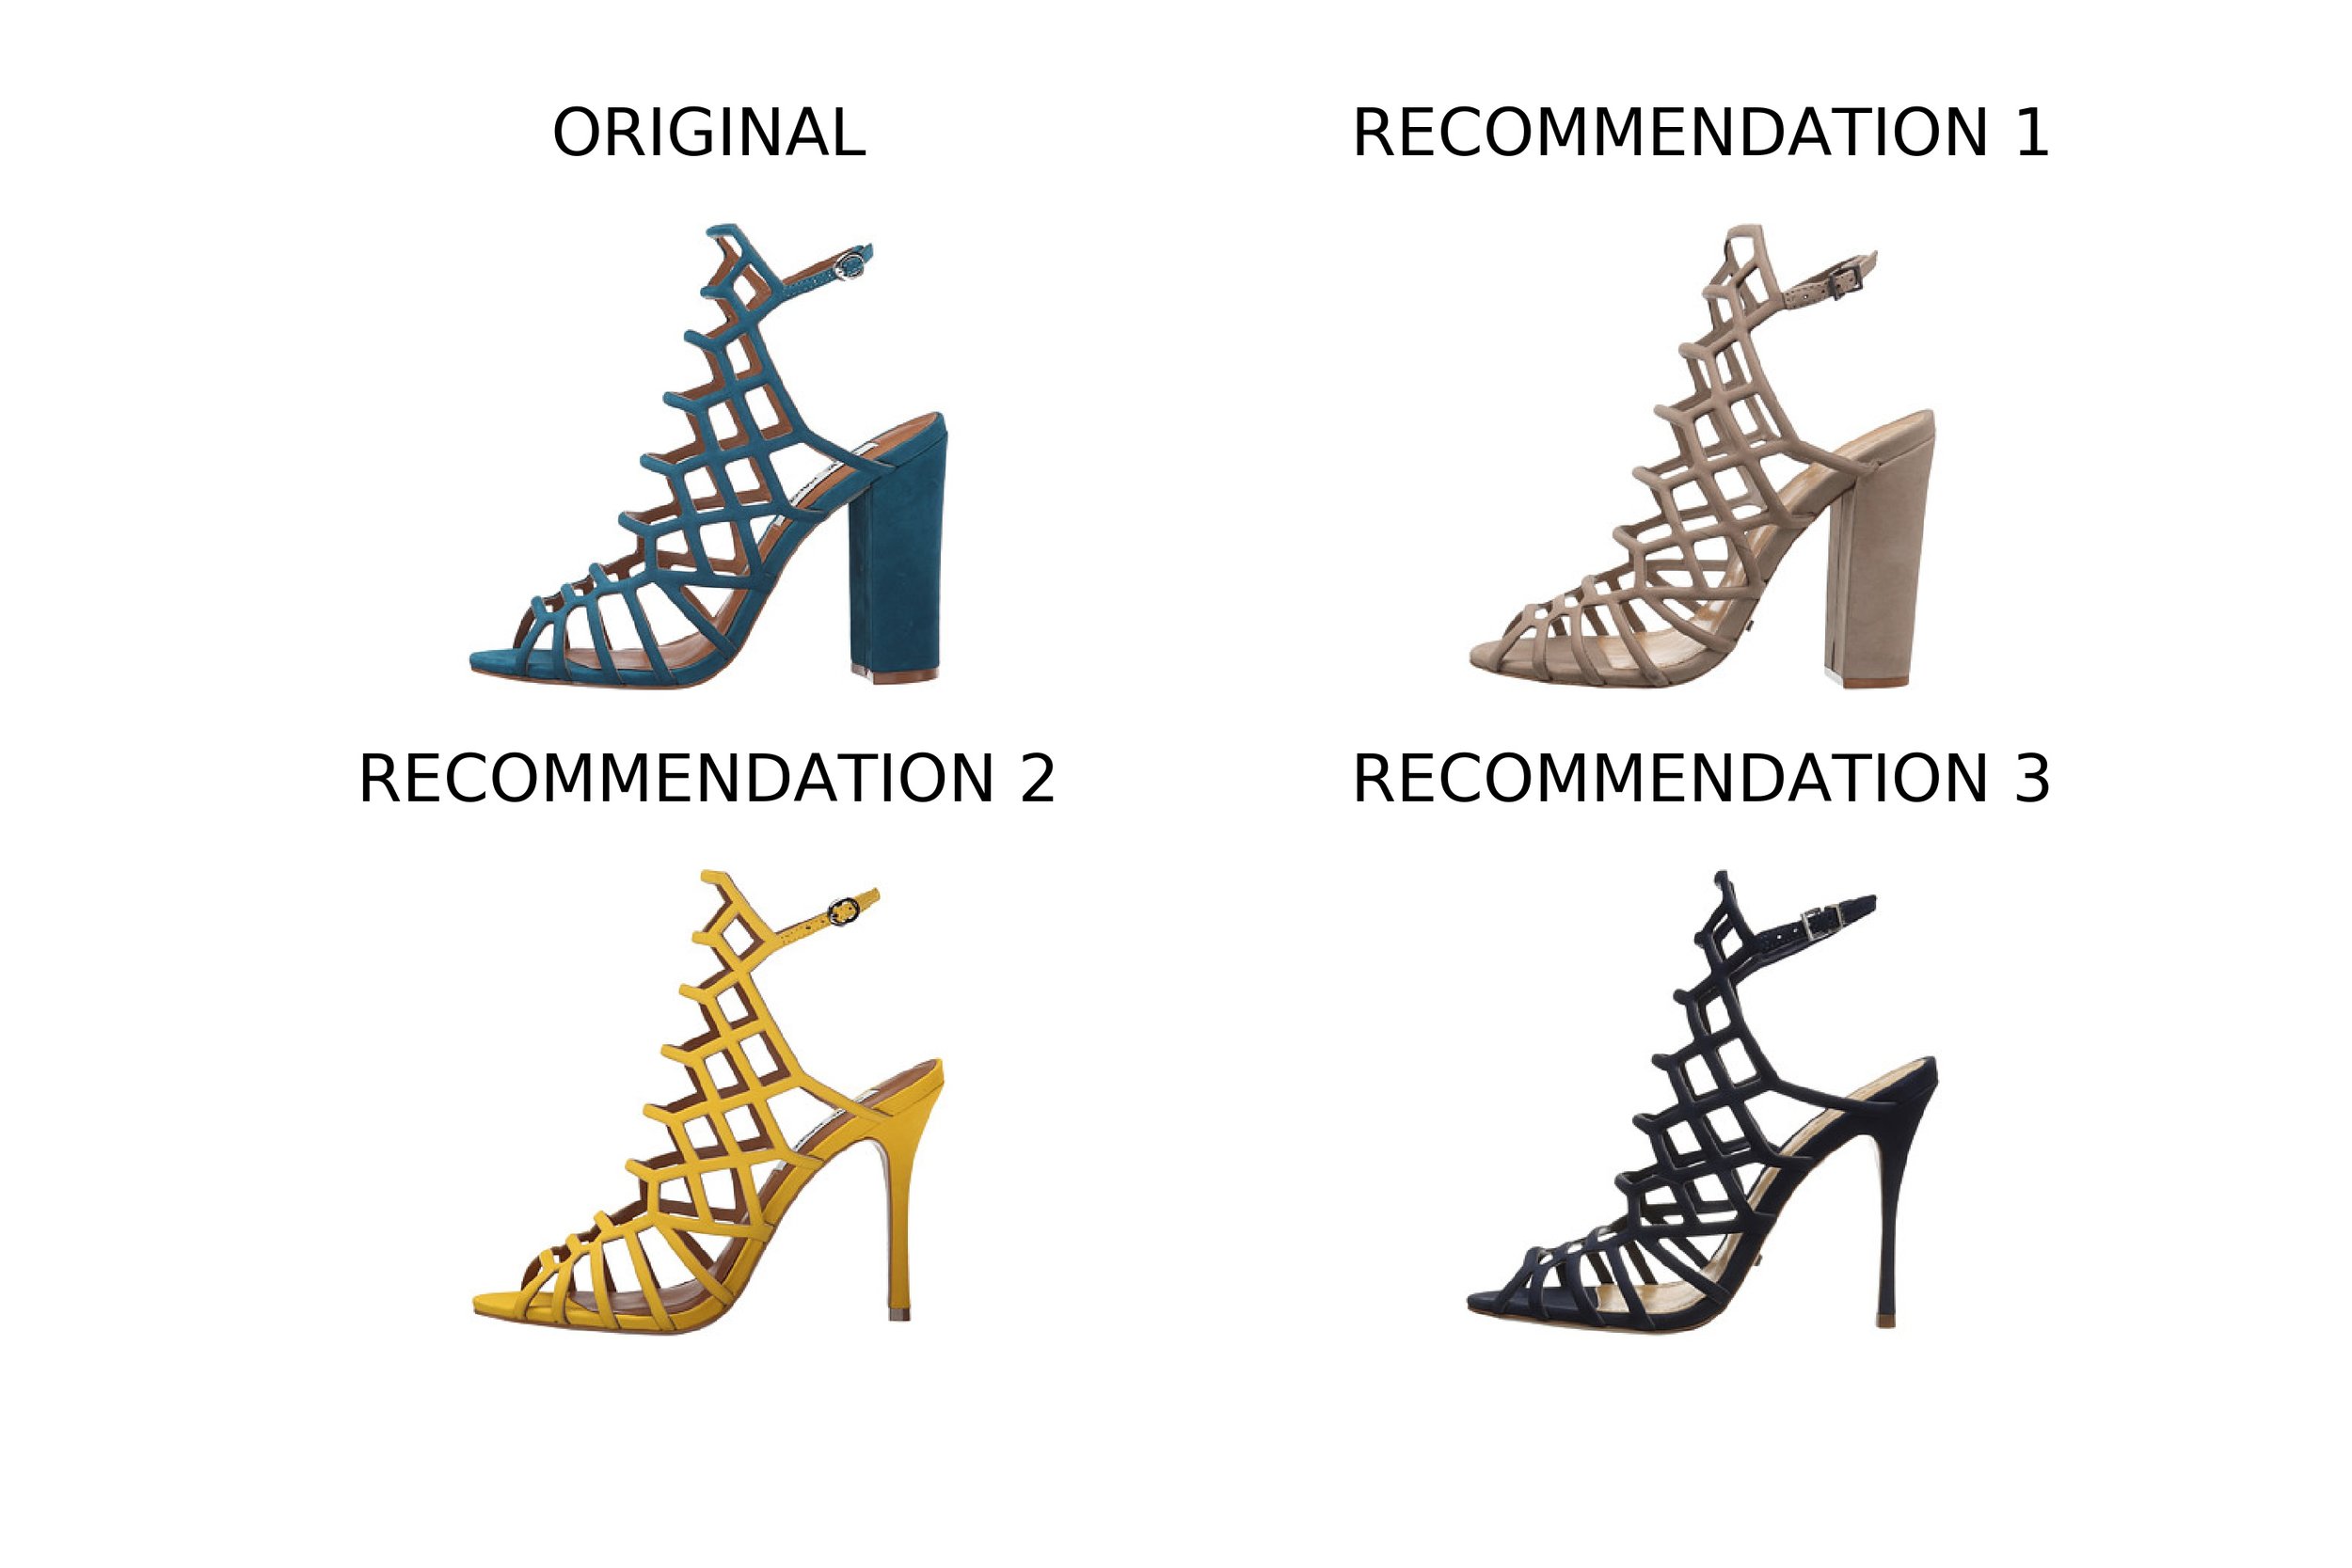
Below we observe a few examples, where we present the Original image (top left) and three recommended products that look very similar. We observe that for a wide range of shoe styles the recommendations are very close. For example, boots present other similar boots.
PRODUCT CLUSTERS
We used a K-Means algorithm to determine the number of possible clusters in our data set. We analyzed the inertia of the model up to 200 clusters. The results are shown in Figure 4 below. Although it is challenging to determine the location where the elbow occurs, we settled on 20 shoe clusters.
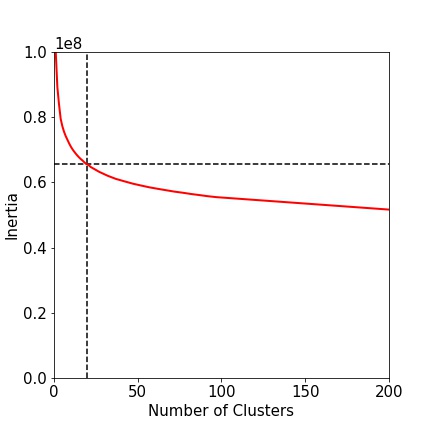
Figure 4: Inertia of the k-means algorithm up to 200 clusters.
We visualized each shoe in a 2 dimensional space using t-SNE for dimensionality reduction. This can be observed in Figure 5, where each dot represents a unique shoe.
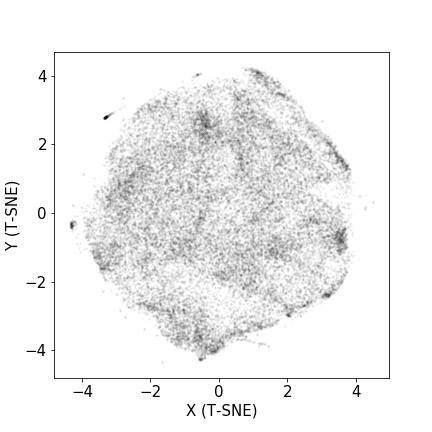
Figure 5: 2-dimensional projection of each shoe in the database after performing a t-SNE procedure.
Finally, for each of the 20 cluster, we extracted the closest shoe to each center as a representation of that cluster. The selected shoes are presented on the top of Figure 6. The shoes from each cluster are highlighted in the t-SNE two dimensional projection plot on the bottom of Figure 6.
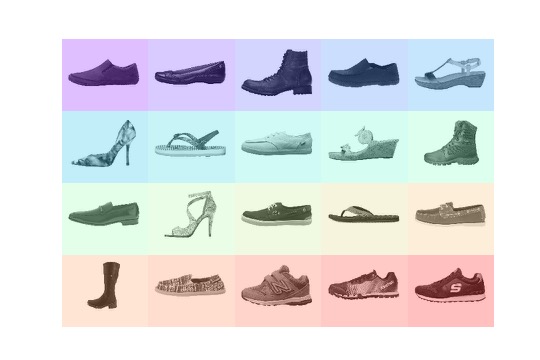
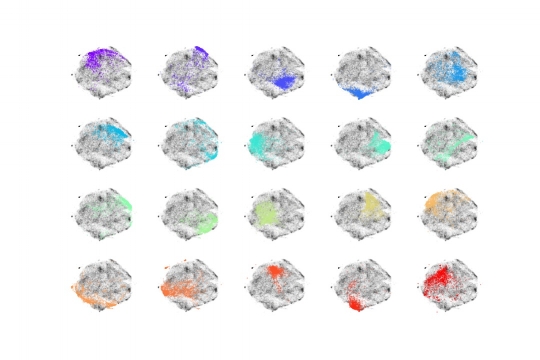
Figure 6: Top: closest shoes to the center of each cluster. Bottom: t-SNE two-dimensional projection highlighting the shoes that belong to each of the 20 clusters.
CONCLUSION
In summary, we were able to create a product recommendation system based on image similarity. We also, used an unsupervised learning technique to extract 20 shoe clusters.
This recommendation system was performed using only the images of the product. It is possible to also include the product metadata such as brand, gender, size, dimensions, etc. for each shoe, and use it to improve the recommendations.
Finally, this method can be used to find similar images within any image data set, and does not need to be limited to shoe products.