
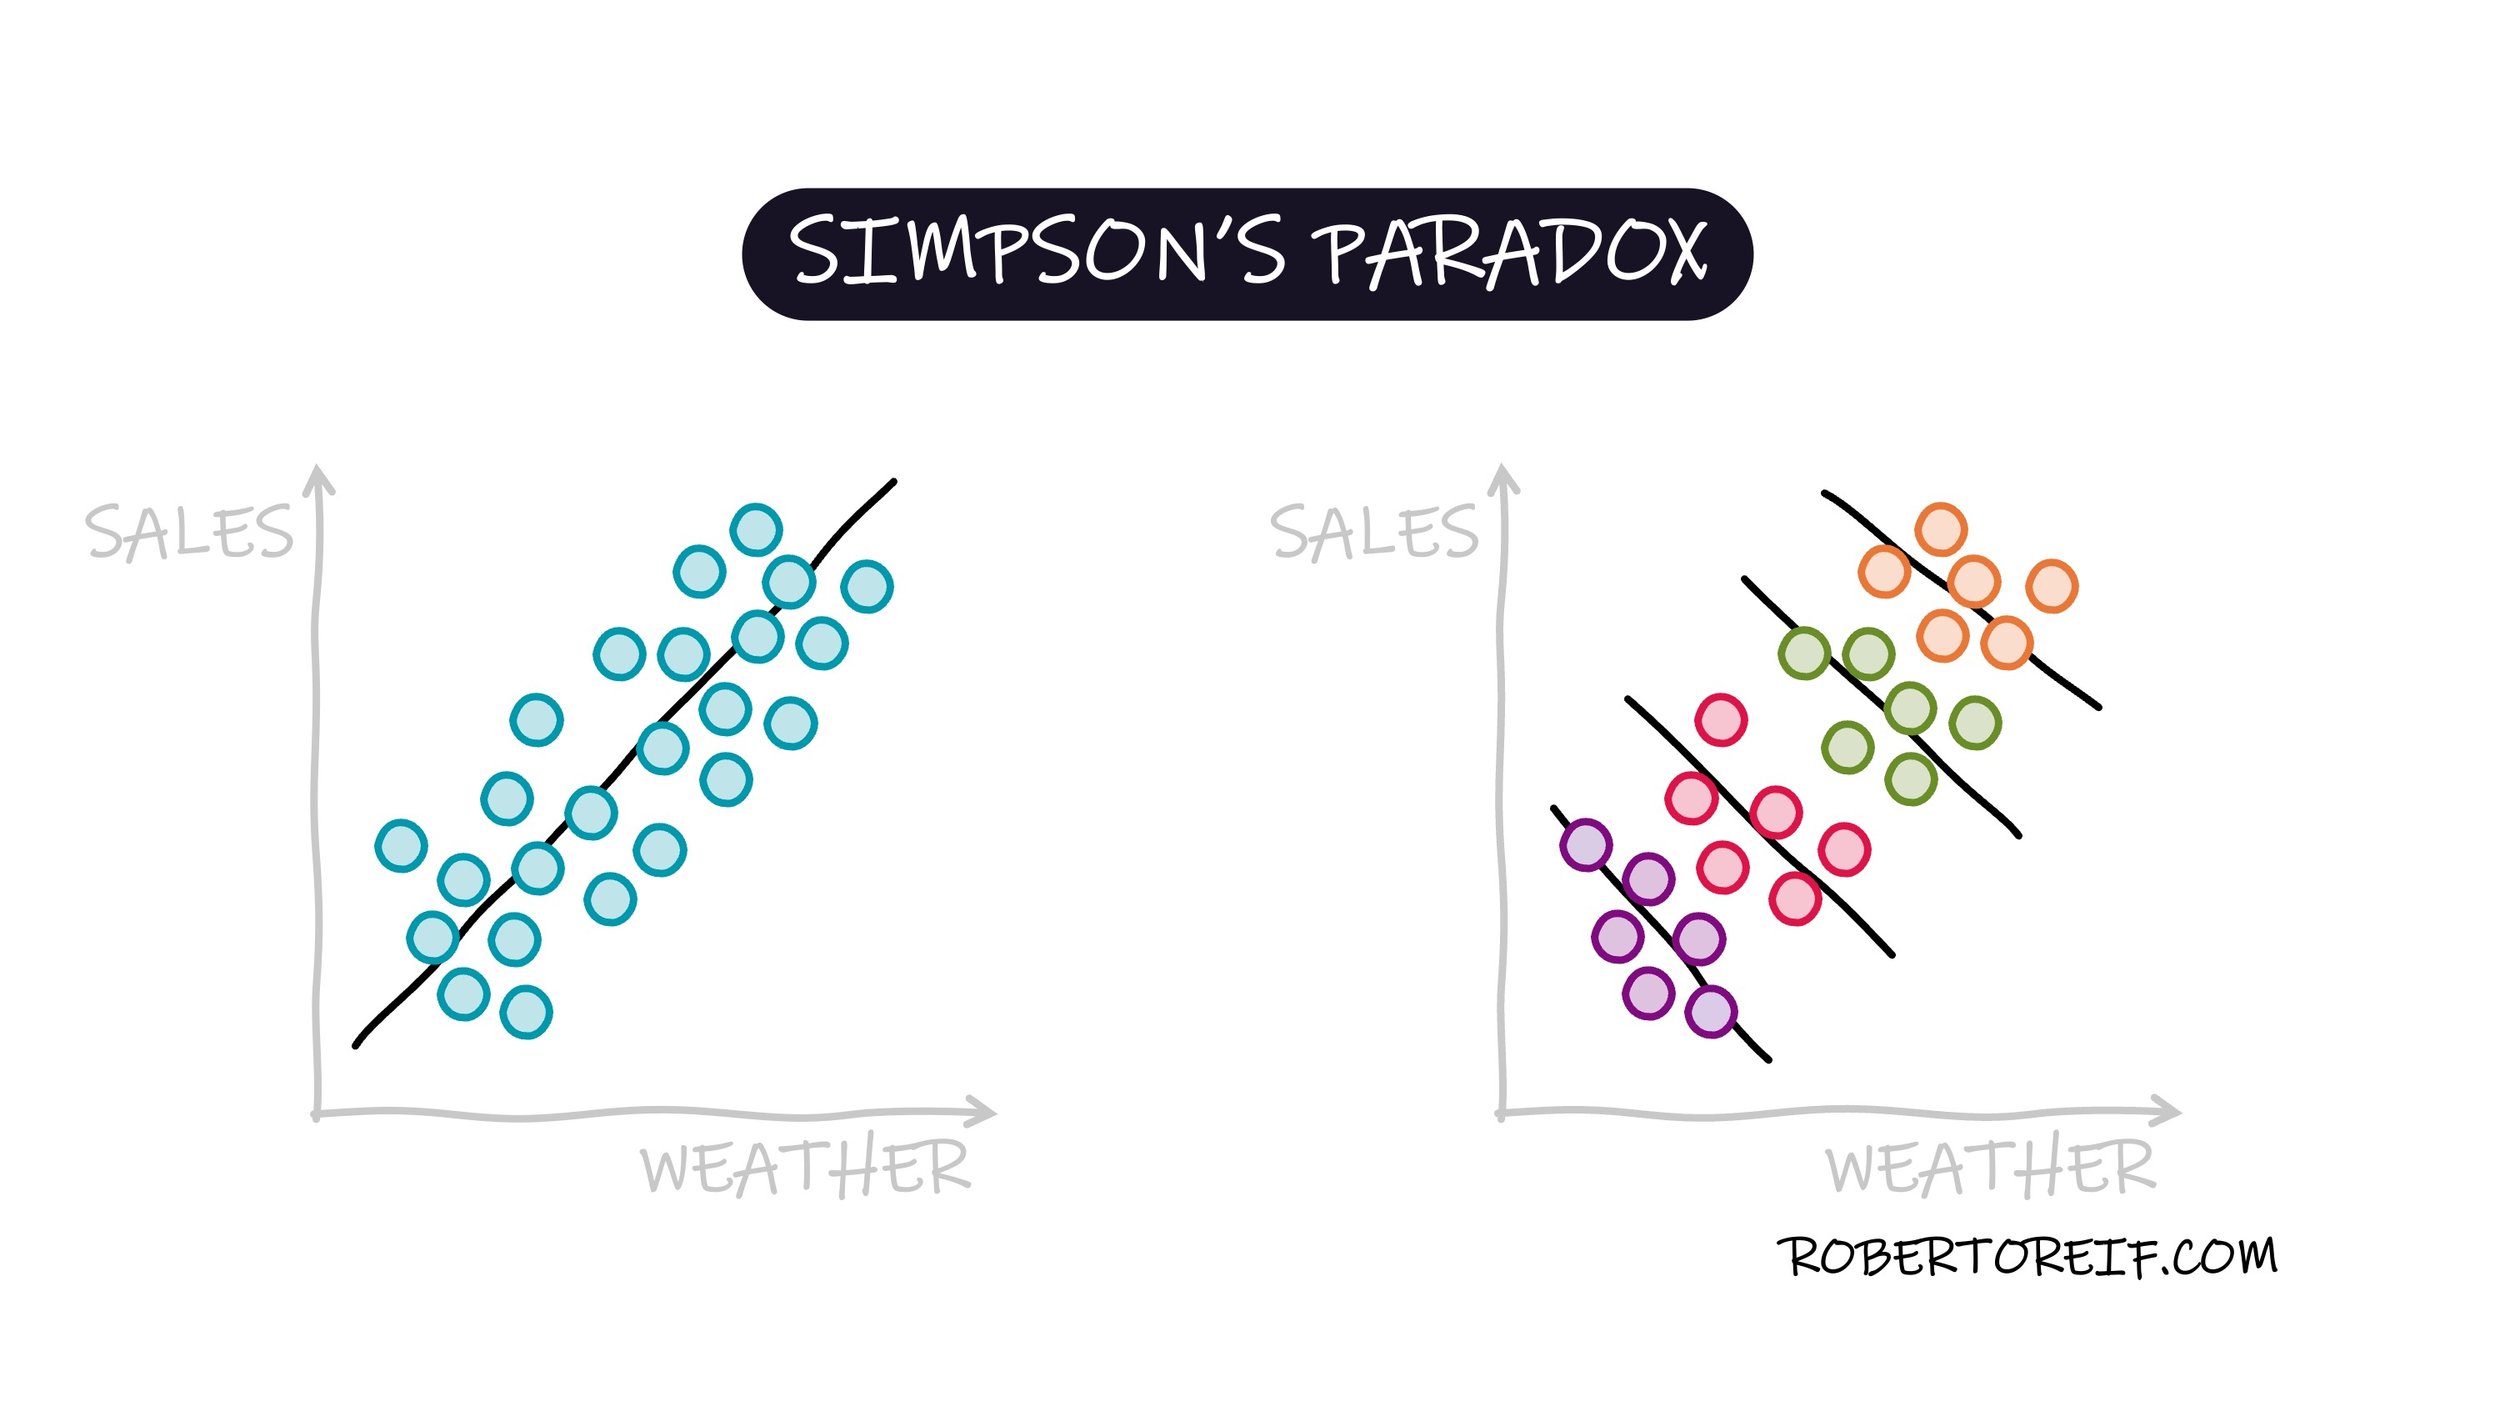
One common challenge when analyzing data is discovering that the same set of numbers can lead to opposite conclusions. One common explanation is the trap of aggregation known as Simpson's Paradox, which affects many professional areas from marketing campaigns to public health initiatives. Let’s break down this powerful paradox using a common business scenario.
Imagine you run a company that operates four retail stores which are located in different cities. You want to know how the weather (shown in the x-axis) affects your sales (shown in the y-axis).
When you pull the total data for all four stores, you observe a positive trend, as temperatures rise, your total company revenue increases, as shown on the graph on the left. The logical conclusion is that warmer days are great for business! Maybe your products are popular in warmer weather climates, or people are simply more likely to shop on those days.
However, a cautious analyst decides to look deeper, and breaks the data down by individual store location. This is where the shock sets in. In the data for each individual store, the trend is reversed. Within each store, revenue drops as the temperature increases, as shown on the graph on the right. The same data tells two different stories, your aggregated data says warm weather is good, while the segmented data by location says warm weather is bad.
How can this be? The answer lies in an uneven distribution of a factor, known as a confounding variable. In this case, the key is the location of your stores.
Let's assume your best store, is located in the warmest city (e.g. Miami), while your worst performing store is located in the coldest city (e.g. Minneapolis). The weather in the location of these stores will create a trend regardless of the daily temperature fluctuations.
As a result, you mistakenly conclude that an increase in temperature causes high revenue, when in reality, it's the location that causes high revenue, and that location just happens to be warm. In this case you were comparing apples (a warm, high-revenue store) to oranges (a cold, low-revenue store) and attributing the difference to the wrong variable, temperature.
Before you draw any conclusions that lead to major business decisions, whether to increase staffing on warm days or launch a seasonal campaign, you must first:
Identify relevant subgroups: Break your data down by store, channel, customer segment, or region.
Look for reversals: If your overall trend reverses in every subgroup, you've likely found a paradox.
Find the confounder: Look for a variable (like store size, location, or customer mix) that is unevenly distributed across your groups.
Failing to account for these subgroups means you might be celebrating an overall trend that actually hurts every single part of your business.
What data deception has surprised you the most?
